Impact of stratospheric air and surface emissions on tropospheric nitrous oxide during ATom, paper published in ACP
Click here for the Spanish version
Accurate observations of atmospheric N2O at global scale are essential to reduce the uncertainties on the spatial distribution of N2O emissions and the sources leading to rising concentrations in the global atmosphere. In this context, the paper, entitled “Impact of stratospheric air and surface emissions on tropospheric nitrous oxide during Atom”, and published by Atmospheric Chemistry and Physics (ACP), analyses the global distribution of tropospheric N2O mixing ratios during the NASA airborne Atmospheric Tomography (ATom) mission. ATom measured mixing ratios of ~300 gas species and aerosol properties in 647 vertical profiles spanning the Pacific, Atlantic, Arctic, and much of the Southern Ocean basins, from nearly Pole to Pole, over four seasons (2016–2018). In this study, we measured N2O mixing ratios at 1 Hz using a Quantum Cascade Laser Spectrometer and we present a new spectral retrieval method to account for the pressure and temperature sensitivity of the instrument when deployed on aircraft.
ATom observations shown that the variance of N2O mixing ratios in the troposphere is mostly driven by the influence of N2O-depleted stratospheric air, especially at mid and high latitudes (Fig. 1). We tracked the downward propagation of stratospheric influenced N2O mixing ratios through the tropospheric column down to the surface (Fig. 1). The highest N2O mixing ratios occur close to the equator, extending through the boundary layer and free troposphere (Fig. 1). We observed influences from a complex and diverse mixture of N2O sources, with emission source types identified using the rich suite of chemical species measured on ATom and with the geographical origin calculated using an atmospheric transport model. Although ATom flights were mostly over the oceans, the most prominent N2O enhancements were associated with anthropogenic emissions, including industry, oil and gas, urban and biomass burning, especially in the tropical Atlantic outflow from Africa from the coastal area of Nigeria. Peaks of N2O are often well-correlated with indicators of photochemical processing, suggesting possible unexpected source processes. The extensive data set from ATom will help improve the understanding of N2O emission processes and their representation in global models.
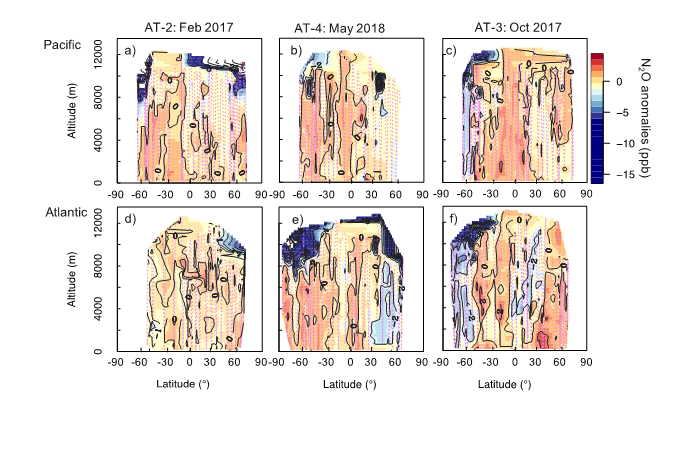
Figure 1. Cross-sections of N2O anomalies (ppb), representing the differences between the airborne N2O (10-s resolution) and the surface N2O mixing ratios interpolated to 0.25° latitude and 250 m altitude for each deployment. Shown are the N2O anomalies over (a)–(c) the Pacific and (d)–(f) the Atlantic, and each column represents a deployment (ordered by season, ATom-2, -4 and -3). The color-scale ranges from -15 to 5 ppb. Values between -50 and -15 ppb, observed at the highest altitudes (>10 km) are shown in white for a better visualization of small changes in positive anomalies. Lilac dashed lines represent the fight tracks. Black contours are areas of the N2O anomalies.
For more details about this work please refer to: Gonzalez, Y., Commane, R., Manninen, E., Daube, B. C., Schiferl, L., McManus, J. B., McKain, K., Hintsa, E. J., Elkins, J. W., Montzka, S. A., Sweeney, C., Moore, F., Jimenez, J. L., Campuzano Jost, P., Ryerson, T. B., Bourgeois, I., Peischl, J., Thompson, C. R., Ray, E., Wennberg, P. O., Crounse, J., Kim, M., Allen, H. M., Newman, P., Stephens, B. B., Apel, E. C., Hornbrook, R. S., Nault, B. A., Morgan, E., and Wofsy, S. C.: Impact of stratospheric air and surface emissions on tropospheric nitrous oxide during ATom, Atmos. Chem. Phys., 21, 11113-11132, 2021, https://doi.org/10.5194/acp-21-11113-2021, https://acp.copernicus.org/articles/21/11113/2021/.
Link: https://acp.copernicus.org/articles/21/11113/2021/