A reconstruction of 73-year time series of the aerosol optical depth (AOD) at the Izaña Atmospheric Observatory has been published at Atmospheric Measurement Techniques journal in Discussion phase (AMTD)

This paper presents the reconstruction of the 73-year time series of the aerosol optical depth (AOD) at 500 nm at the subtropical high-mountain Izaña Atmospheric Observatory (IZO) located in Tenerife (Canary Islands, Spain). For this purpose, we have combined AOD estimates from artificial neural networks (ANN) from 1941 to 2001 and AOD measurements directly obtained with a Precision Filter Radiometer (PFR) between 2003 and 2013.The input parameters of the ANN are visibility horizontal (VIS), fraction of clear sky (FCS) and relative humidity (HR). The analysis is limited to summer months (July-August-September), when the largest aerosol load is observed at IZO (Saharan mineral dust particles). The ANN AOD time series has been comprehensively validated against coincident AOD measurements performed with a solar spectrometer Mark-I (1984-2009) and AERONET (AErosol RObotic NETwork) CIMEL photometers (2004-2009), obtaining a rather good agreement on a daily basis: Pearson correlation coefficient, R, of 0.97 between AERONET and ANN AOD, and 0.93 between Mark-I and ANN AOD estimates (Figure 1).
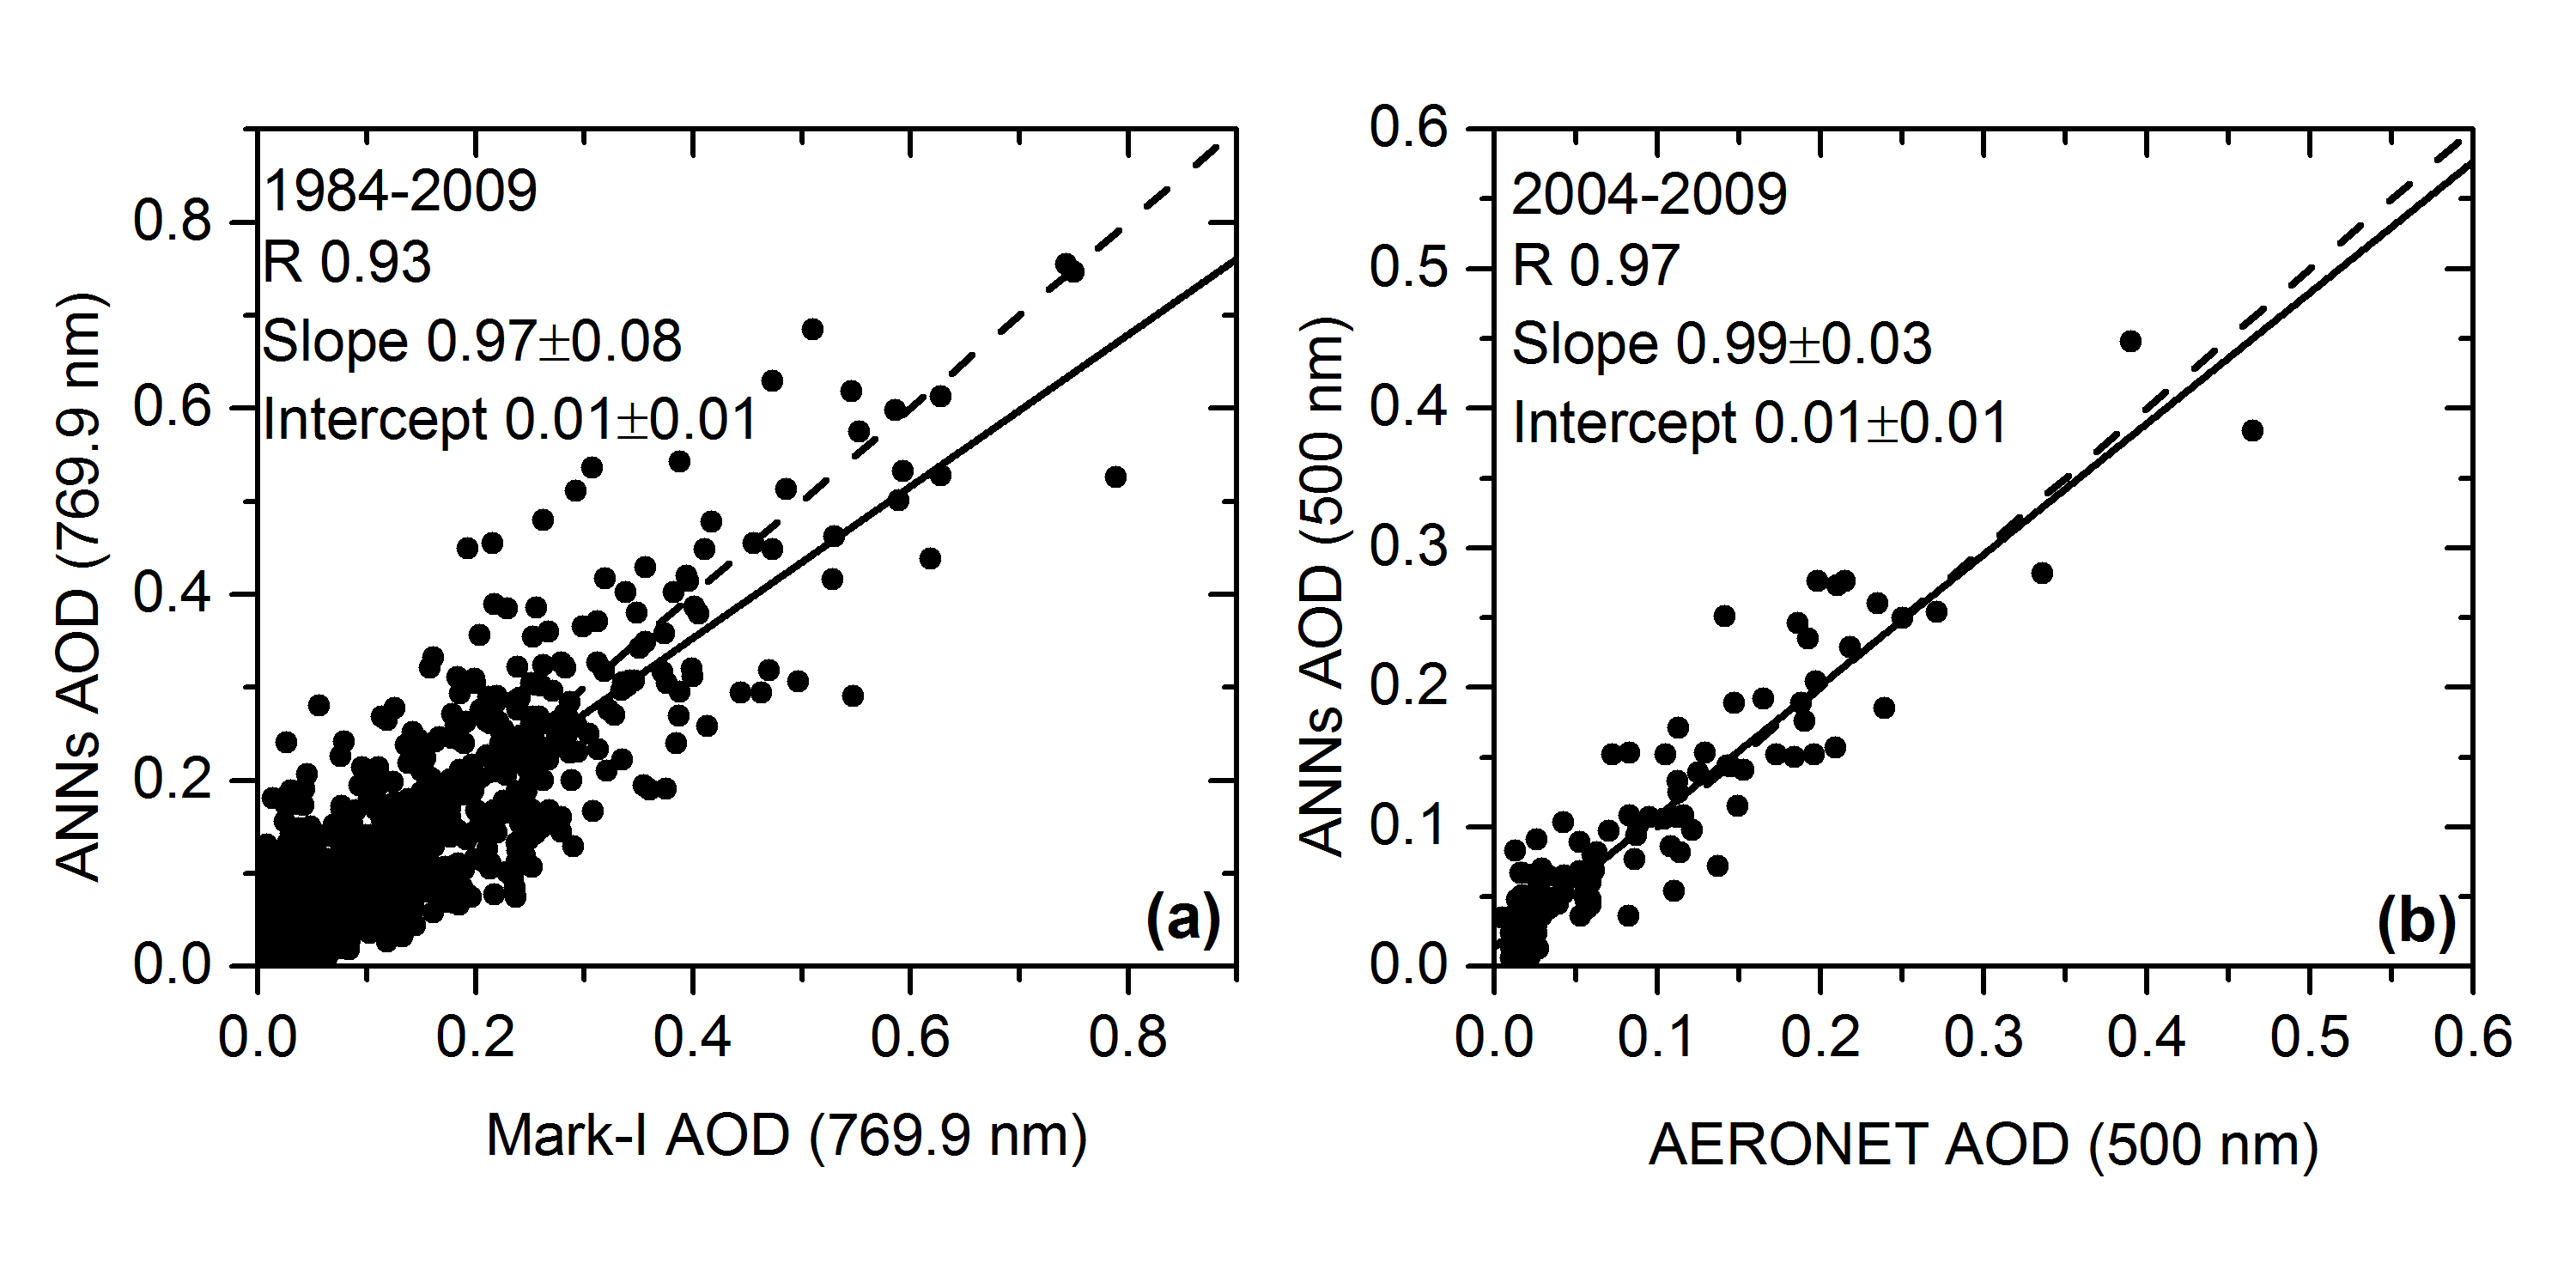
Figure 1.- Scatterplot of ANN AOD estimates versus (a) daily Mark-I AOD at 769.9 nm for all the cloud- free days (oktas=0) and (b) daily AERONET AOD at 500 nm for the periods 1984-2009 and 2004-2009, respectively. The black solid lines are the least-square fits and the dotted lines are the diagonals. The least-square fit parameters are shown in the legend (Pearson correlation coefficient, R, slope and intercept). To compare the Mark-I AOD values at 769.9 nm and the ANN AOD estimates at 500 nm, we have extrapolated the AOD ANN values from 500 to 769.9 nm by using the Ångström’s Law (Angstrom, 1992).
In addition, we have analyzed the long-term consistency between ANN AOD time series and long-term meteorological records identifying Saharan mineral dust events at IZO (synop observations and local wind records). Both analyses provide consistent results, with correlations larger than 0.85 (Figure 2). Therefore, we can conclude the reconstructed AOD time series captures well the AOD variations and dust-laden Saharan air mass outbreaks at short-term and long-term time scales and, thus, it is suitable to be used in climate analysis.
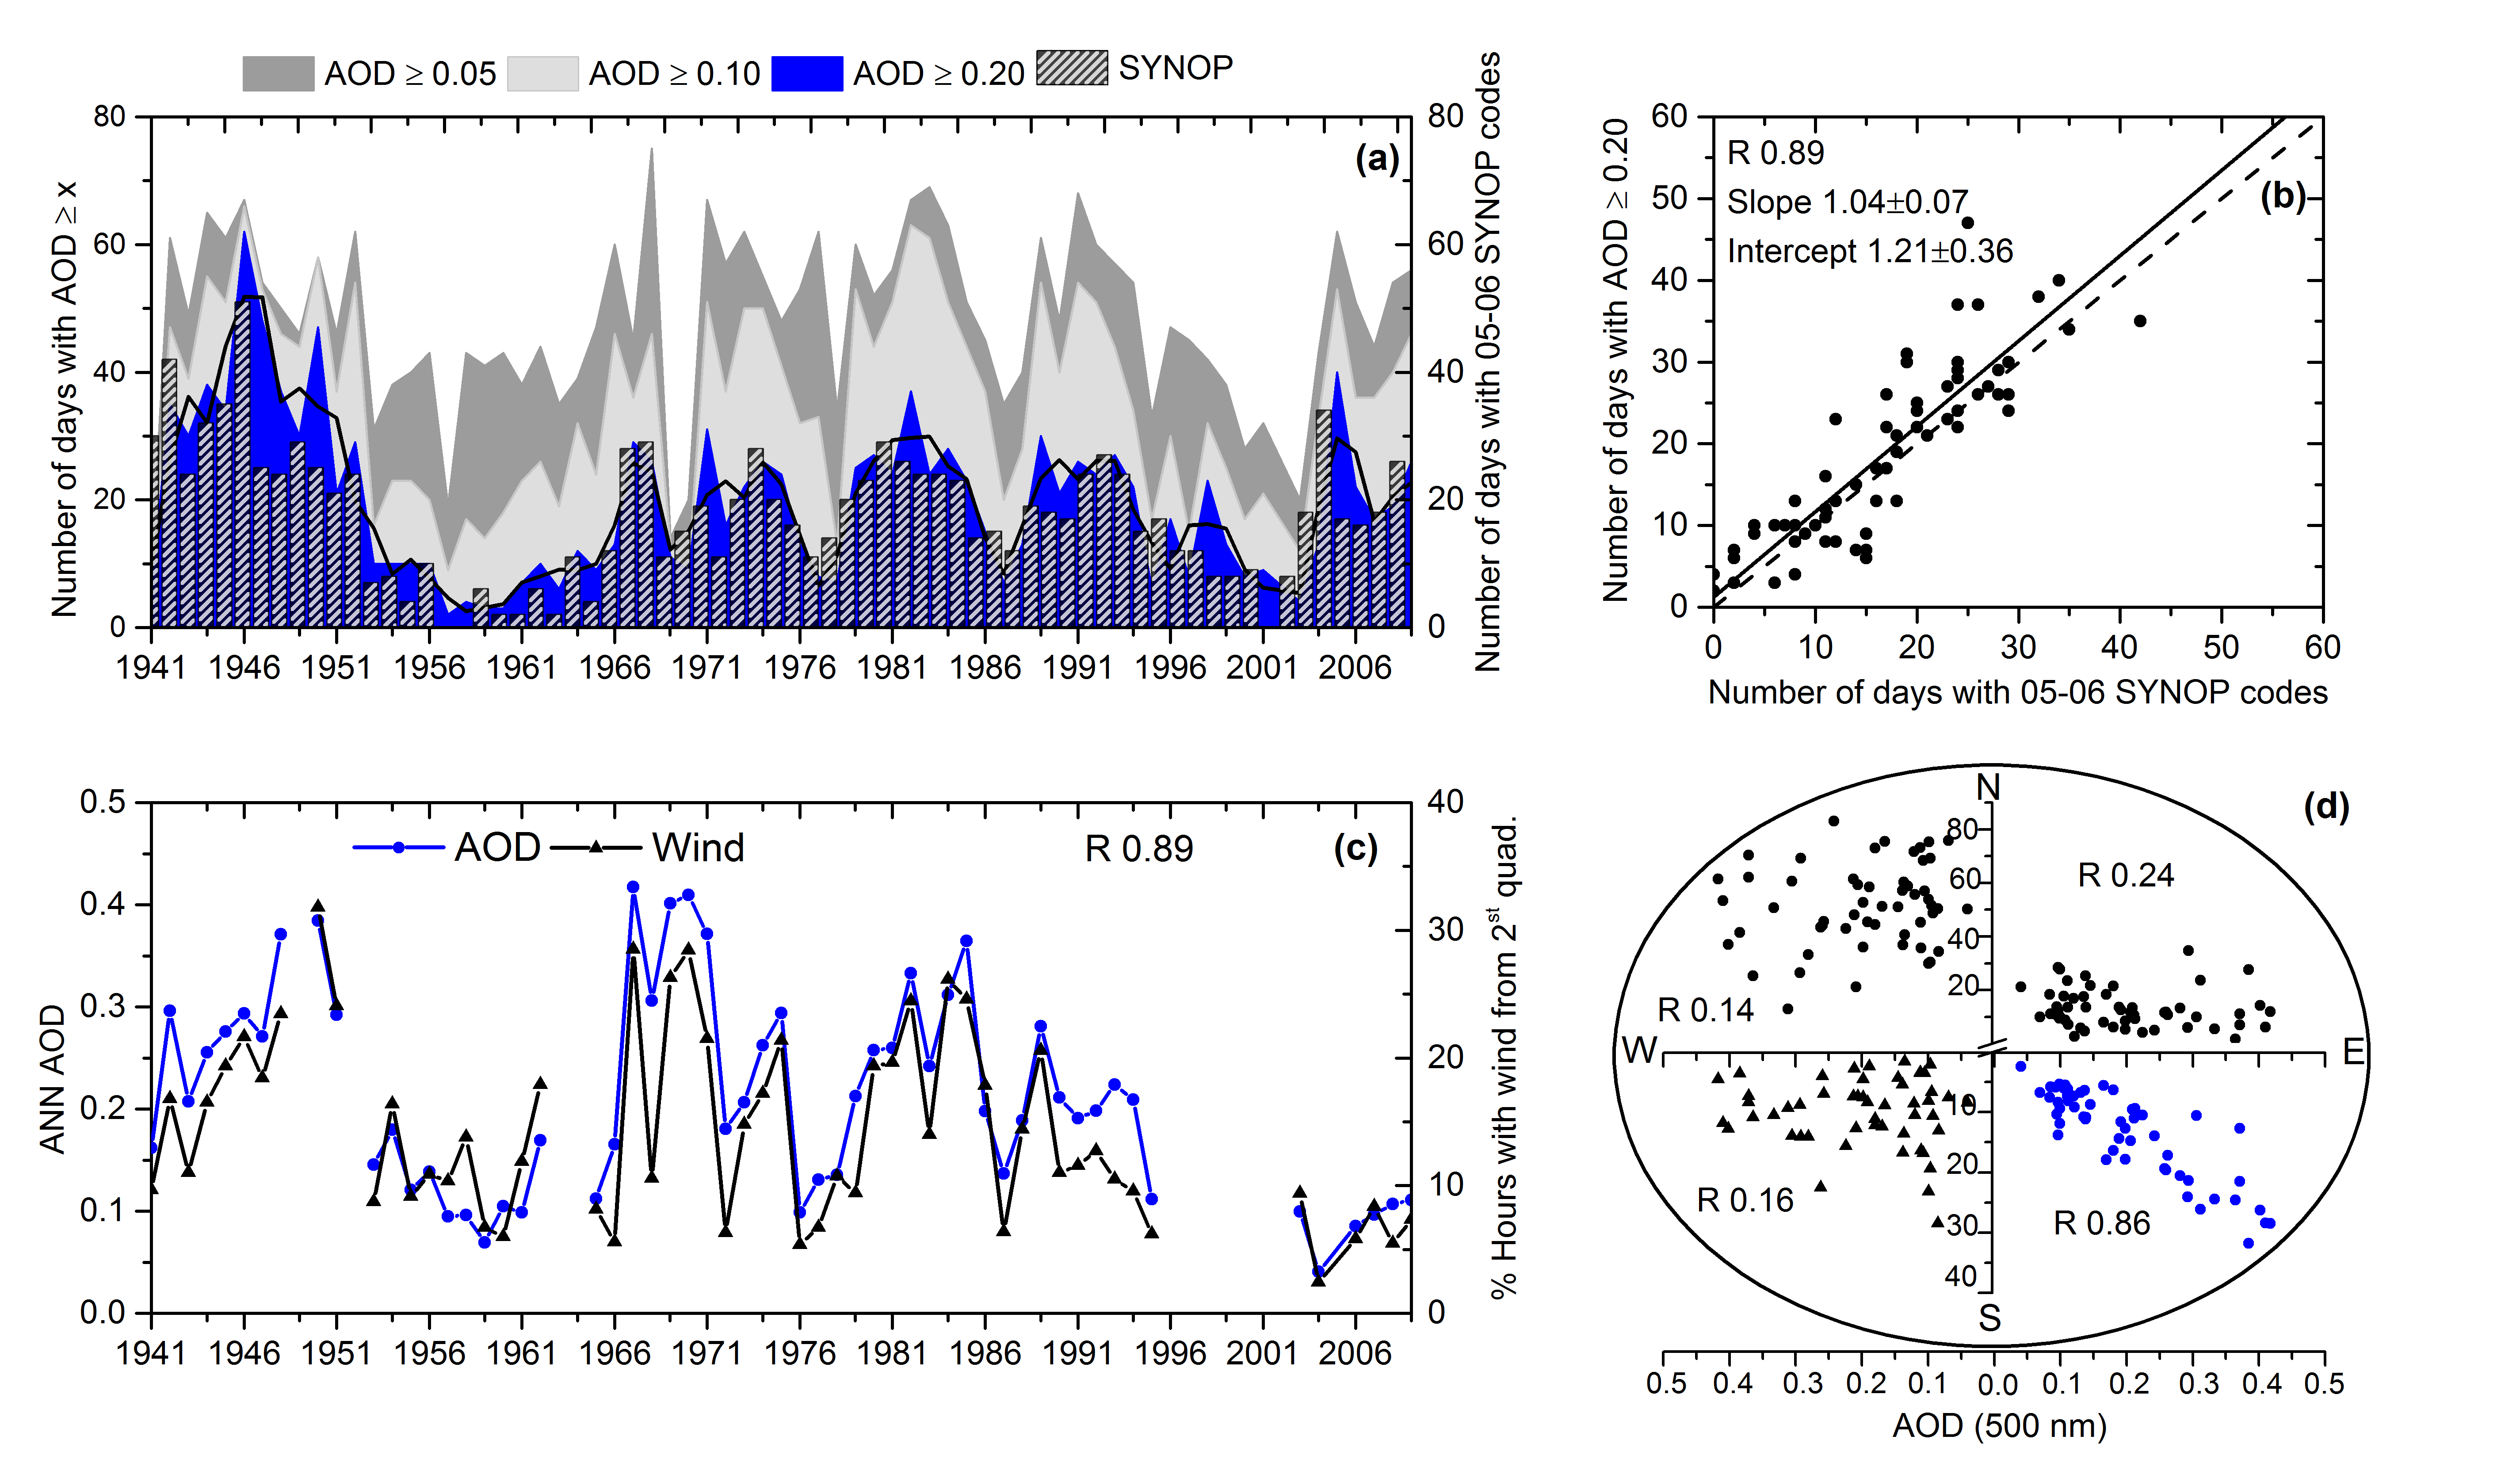
Figure 2.- (a) Time series of the number of days grouped into ANN AOD intervals (AOD≥0.05; AOD≥0.10; AOD≥0.20) on the left axis, while on the right axis, the bars indicate the number of days with SYNOP data reporting dust in suspension (05-06 SYNOP codes) for the period 1941-2009. The five-yr running mean is shown in black. (b) Scatter-plot of number of days with ANN AOD≥0.20 and number of days with 05-06 SYNOP codes. The least-square fit parameters are shown in the legend. (c) Time series of the ANN AOD monthly medians (blue line) and monthly percentage of time the wind blows from the second quadrant (E-S; 90°-180°) (black line) at IZO in July in the period 1941-2009. (d) Percentage of time (y-axis) the wind blows from in each one of the four quadrants versus the ANN AOD monthly medians (x-axis). R indicates the Pearson coefficient.
Further details about this study can be found at the on-line paper:
García, R.D., García, O.E., Cuevas, E., Cachorro, V.E., Barreto, A., Guirado-Fuentes, C., Kouremeti, N., Bustos, J.J., Romero-Campos, P. M., and de Frutos, A.M. : Aerosol Optical Depth retrievals at the Izaña Atmospheric Observatory from 1941 to 2013 using artificial neural networks, Atmos. Meas. Tech. Discuss., 8, 9075-9103, doi:10.5194/amtd-8-9075-2015, 2015.
The paper can be downloaded at: http://www.atmos-meas-tech-discuss.net/8/9075/2015/amtd-8-9075-2015.html