
Analysis of greenhouse gases in the atmosphere based on global observations through 2015
On October 24th, 2016, the World Meteorological Organization (WMO) published its twelveth annual atmospheric greenhouse gas bulletin (click here to download the bulletin in pdf format), based on global observations through 2015. Most of these measurements were carried out at stations of the Global Atmosphere Watch (GAW) programme of the WMO. In particular, Izaña Atmospheric Research Center (CIAI) of the Meteorological State Agency of Spain (AEMET) contributes with highly precise and accurate measurements carried out at the Izaña global GAW station (Tenerife), showed in the panel with four plots that heads this article (click here to download a pdf with that 4-plot panel; click here to download a pdf with the CO2 plot; click here to download a pdf with the CH4 plot; click here to download a pdf with the N2O plot; click here to download a pdf with the SF6 plot).
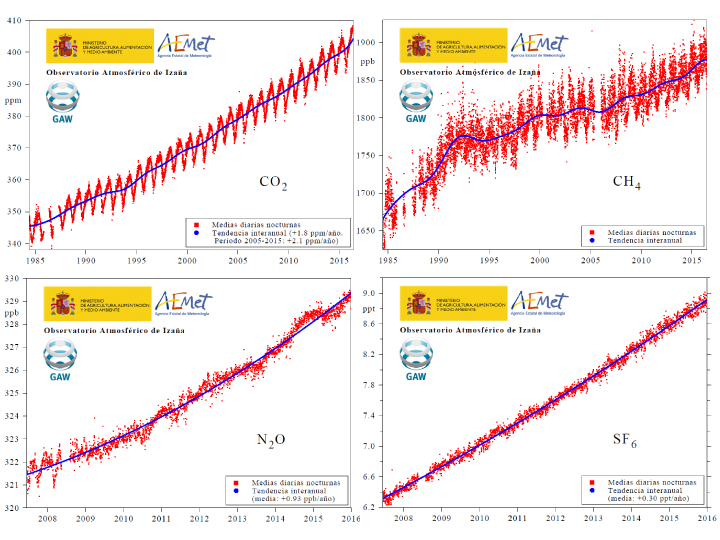
Globally and annually averaged mole fractions of CO2, CH4 and N2O reached new highs in 2015: with CO2 at 400.0 ppm (parts per million –molecules of CO2 per million of dry air molecules-), CH4 at 1845 ppb (parts per billion) and N2O at 328.0 ppb. These values represent, respectively, 144%, 256% and 121% of pre-industrial levels (before 1750). The background atmospheric annual mean mole fractions measured at Izaña Observatory during the year 2015 were: 400.8 ppm for CO2, 1871 ppb for CH4, and 328.6 ppb for N2O (note that the mole fractions measured at Izaña are greater than the background world means, due to the fact that most of the anthropogenic sources of greenhouse gases are in the Northern Hemisphere. In the Southern Hemisphere, mole fractions are a bit smaller than in the Northern one due to the time it takes to the atmosphere to transport such gases from one Hemisphere to the other one).
The global atmospheric CO2 increase from 2014 to 2015 (difference of annual means) was 2.3 ppm, whereas for CH4 was 11 ppb and for N2O was 1.0 ppb (very close to those measured at Izaña). This value of 2.3 ppm/year is larger than the corresponding to the previous year, and also than the mean annual increase during the last decade (2.1 ppm/year). This is attributed to the El Niño climate event that has happened during 2015 and 2016.
The radiative forcing (above the natural pre-industrial level) due to long-lived greenhouse gases has increased 37% above the level of the year 1990 (CO2 accounting for 80% of this increase).