COVID-19 Crisis Reduces Free Tropospheric Ozone across the Northern Hemisphere. Click here for the Spanish version
During the spring-summer of 2020, the global crisis associated with COVID-19 caused all countries to take drastic measures to contain the spread of the virus, such as confining the population to their homes and, in many countries, the reduction of a great part of non-essential industrial, commercial and transport activity. These measures brought about a significant reduction in the emission of gases, not only in the lower layers of the atmosphere, but also throughout the troposphere due to the reduction of emissions associated with air transport. Faced with this situation, the international scientific community has questioned what effects this reduction in gas emissions has had on the environment and how it has affected the average distribution of certain gases in the free atmosphere, as is the case of tropospheric ozone (O3).
In order to find out how ozone in the free atmosphere responded during this period of emission reduction in 2020, the scientific community working on the measurement of tropospheric ozone has collaborated on the comparison and analysis of vertical profiles of ozone obtained using three different measurement techniques: ozone sounding, Fourier Transform Infrared Spectrometers (FTIR) and tropospheric LIDAR (Light Detection and Ranging). This collaboration of more than 30 institutions in 16 countries has resulted in the publication of the article “COVID-19 Crisis Reduces Free Tropospheric Ozone across the Northern Hemisphere”, https://doi.org/10.1029/2020GL091987, (Steinbrecht et al., 2021), which gives the keys to understanding the behaviour of ozone in the free atmosphere during the period. Four members of AEMET took part in the work, contributing with IARC FTIR measurements at Izaña Observatory (Tenerife) and with ozone profiles of the soundings carried out at Barajas (Madrid) and Tenerife.
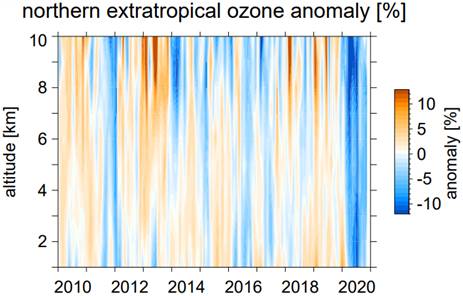
Figure 1. Vertical distribution of the average tropospheric ozone anomalies for the extra-tropical region in the northern hemisphere during the spring-summer period 2010-2020. A blue band is observed in 2020 corresponding to low ozone levels throughout the free troposphere. This remarkable reduction in tropospheric ozone is mainly caused by global gas emission reductions due to the economic downturn, a consequence of COVID-19. Credit: Steinbrecht et al., (2021).
Direct reduction in the burning of fuels in industry/transport implies a reduction in the emission of compounds such as nitrogen oxides (NOx) and volatile organic compounds (VOCs). These compounds are directly involved in the photochemical reactions of generation and depletion of ozone in the atmosphere. In atmospheres with low to medium initial pollution, a decrease in the emission of NOx and/or VOCs reduces the photochemical production of ozone, which implies a reduction in ozone. On the other hand, in atmospheres with previously high levels of pollution, the reduction of NOx can increase ozone concentration, since there will be lower levels of NOx available to intervene in ozone depletion reactions.
In the free atmosphere, ozone is an important greenhouse gas that plays a key role in tropospheric chemical reactions, given its high oxidizing capacity. The free troposphere of the northern hemisphere is dominated by the net photochemical production of ozone, which is proportional, although not linear, to the availability of its precursor gases. Furthermore, in global distribution of tropospheric ozone, atmospheric circulation must also be taken into account, with latitudinal transport of air masses of different ozone content, as well as stratosphere-troposphere exchanges.
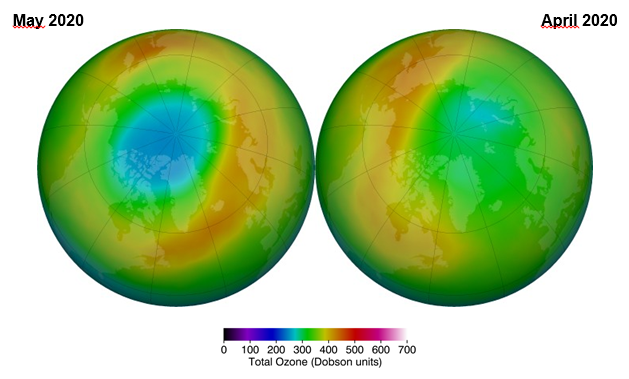
Figure 2. Images of the monthly average of the total ozone content over the Arctic region during 2020, obtained from satellite data. Images from NASA Ozone Watch, Goddard Space Flight Centre/NASA (https://ozonewatch.gsfc.nasa.gov/NH.html).
The spring-summer of 2020 was not only atypical due to the crisis associated with COVID-19, which has caused a reduction in gas emissions on a global scale, but also at the atmospheric circulation level since the period was characterized by a record decrease of the ozone layer in the Arctic (Figure 2). That decrease in ozone in the stratosphere, whose causes were mainly meteorological, was due to the fact that during the winter period a very strong, persistent polar vortex with very low temperatures in the stratosphere hovered over the Arctic. This “blocking” situation favoured the concentration of compounds that accelerate ozone depletion reactions, which meant that, from spring onwards, more ozone was depleted with the increase in solar radiation, UV radiation, in the region. Circulation itself caused these ozone-poor air masses to drift to latitudes lower than normal. A similar situation occurred in 2011, when very low levels of ozone were detected in the stratosphere over Europe and Canada, with an increase in the UV index on the surface. Comparing these two episodes (2011 and 2020), with such significant ozone reduction, allows us to understand how much of the decrease in ozone observed last year was due to meteorological causes (circulation/transport) and which could have other causes.
For the analysis of tropospheric ozone in 2020 during the reduction in emissions associated with the COVID-19 crisis, vertical ozone profiles obtained by means of three different measurement techniques were used, in order to rule out that the result observed was directly related to the ozone measurement method applied. Ozone soundings from 31 stations were used, which carried out at least one sounding per month from the year 2000 to July 2020. Ozone soundings tell us the vertical distribution of ozone in the troposphere and in the stratosphere up to an approximate altitude of 30km, with a vertical resolution of about 100m and ozone content accuracy of 5% -15% in the troposphere and 5% in the stratosphere (WMO, 2014). In addition, vertical ozone profiles obtained from FTIR spectrometers at 12 stations were used which, although they have lower vertical resolution than the soundings, give a similar degree of accuracy (5% -10%, Vigouroux et al., 2015), and data from 2 tropospheric LIDARs, which provide ozone profiles between 3 and 12 km, with comparable accuracy (5% -10%, Leblanc et al., 2018).
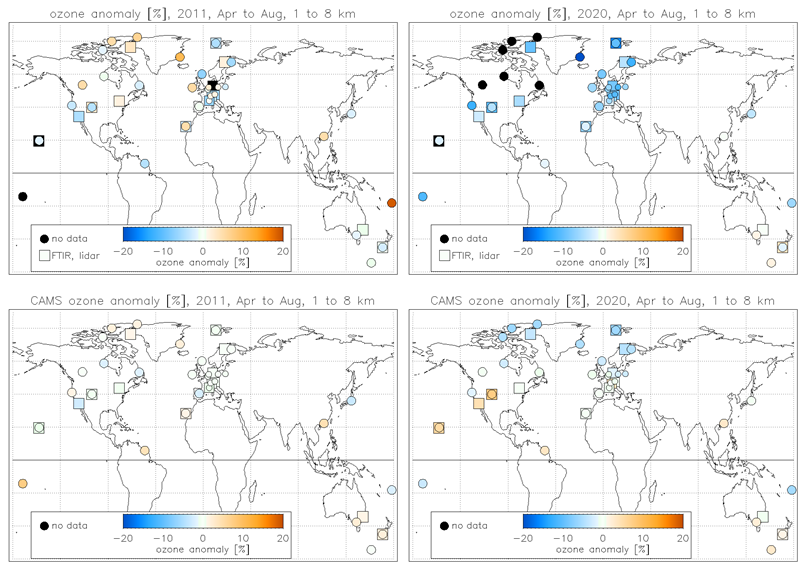
Figure 3. Geographic distribution of the average tropospheric ozone anomalies (average for the months of April to August for an altitude of 1 to 8 km). Upper graphs: anomaly for ozone soundings (circle) and for FTIR or LIDAR (square), for the years 2011 and 2020 (left and right, respectively). Bottom graphs: Anomaly for CAMS, for the years 2011 and 2020 (left and right, respectively). Credit: Steinbrecht et al., (2021).
In addition, ozone data observed with re-analyses (2003-2019) and analysis (2020) of the atmospheric composition of the Copernicus Atmosphere Monitoring Service (CAMS) were also compared (Figure 3). These (re)analyses are based on meteorological fields and on assimilation of satellite O3 and NO2 observations. When interpreting these data, it must be taken into account that, at the tropospheric level, both NOx and O3 are influenced more by pre-set emissions than what happens in the stratosphere, where the influence is greater on the part of assimilation of satellite data. In the case of the 2020 CAMS analyses, pre-established emissions have been taken into account, and not emission reduction due to the COVID-19 crisis.
When comparing the vertical profiles of ozone anomalies averaged from April to August for each season (Figure 4) for the years 2011 and 2020 in which, as indicated above, the greatest reduction in stratospheric ozone is associated with the polar vortex in the Arctic, we see a clear difference. In 2011, the average reduction of the anomaly is observed above 9 km, whilst below that it is minimal, so the reduction of stratospheric ozone seems to have little influence on the concentration of tropospheric ozone, whilst in 2020, the negative anomaly is observed at all levels. When evaluating the CAMS (re)analysis for 2011, a very similar result is obtained as that for averages of anomalies obtained with observations: a minimum of the anomaly in the stratosphere and around zero in the free troposphere. On the other hand, although the CAMS analysis for 2020 reproduces a situation equivalent to that for 2011, with a minimum of stratospheric ozone and little influence on the free troposphere, it does not coincide with the anomalies obtained from the ozone profiles in the free troposphere. Taking into account that the CAMS 2020 analysis used pre-set emissions that did not reflect the reduction in gas emissions due to the COVID crisis, it seems that a large part of the reduction of tropospheric ozone in the free atmosphere during 2020 was mainly due to the reduction in emissions due to the COVID crisis. In addition, the anomaly observed is consistent with simulations of chemical-climatic models, in which a reduction in emissions similar to what happened during that period of 2020 was assumed (Weber et al., 2020).
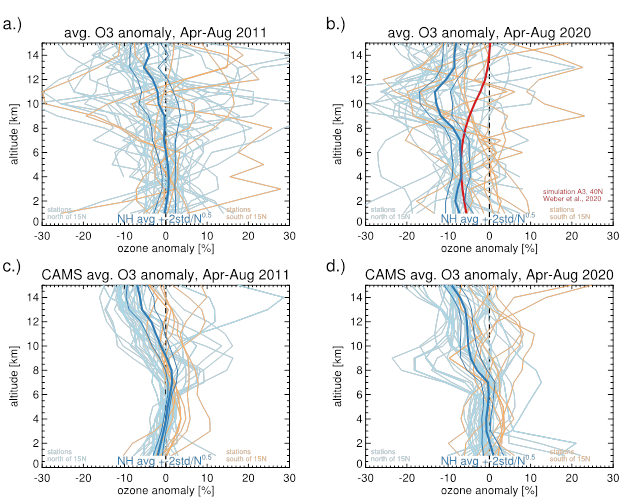
Figure 4. Ozone anomaly profiles (%) averaged from April to August of each season for 2011 (figure 4.a) and 2020 (figure 4.b). The blue lines are the profiles corresponding to extra-tropical stations in the northern hemisphere (> 15ºN), while the rest of the stations are represented by the orange lines (south of 15ºN). The dark blue line corresponds to the average of all the extra-tropical stations in the northern hemisphere, while the light blue lines correspond to the 95% confidence interval. The red line in figure 4.b corresponds to a simulation for 40ºN by Weber et al. (2020). Figures 4.c and 4.d are equivalent to Figures 4.a and 4.b, respectively, but with the CAMS (re)analyses at the point closest to each station. Credit: Steinbrecht et al., (2021).
From the analysis of all the data, it is concluded that, between April and August 2020, the extra-tropical stations of the northern hemisphere measured an average of 7% (~ 4 nmol / mol = ppb) less tropospheric ozone (between 1 and 8 km) than normal (reference average 2000-2020) (Figures 1 and 3). Specifically, the average anomaly observed in that period in Tenerife (Izaña Observatory) with FTIR was -6.3% (0.0% CAMS anomaly) and -1.6% (0.0% CAMS anomaly) in the ozone soundings, whilst in the ozone soundings for Madrid (Barajas) it was -6.3% (0.4% CAMS anomaly). That decrease in ozone, observed over several consecutive months and simultaneously at a large number of extra-tropical stations in the northern hemisphere, had not occurred in recent years, at least since the year 2000. That reduction, on average of 7% in the free troposphere, contrasts with the increase of 10% – 30% in surface ozone observed in polluted urban areas, coinciding with the reduction in emissions due to COVID-19, which has been reflected in various studies carried out on the matter.
Further information: Lower atmosphere ozone dropped 7% during COVID-19 pandemic, study finds – AGU Newsroom
References:
Leblanc, T., Brewer, M. A., Wang, P. S., Granados-Muñoz, M. J., Strawbridge, K. B., Travis, M., et al. (2018). Validation of the TOLNet lidars: the Southern California Ozone Observation Project (SCOOP). Atmospheric Measurement Techniques, 11, 6137–6162. https://doi.org/10.5194/amt-11-6137-2018.
Steinbrecht, W., Kubistin, D., Plass-Dülmer, C., Davies, J., Tarasick, D.W., Gathen, P.V., Deckelmann, H., Jepsen, N., Kivi, R., Lyall, N., Palm, M., Notholt, J., Kois, B., Oelsner, P., Allaart, M., Piters, A., Gill, M., Van Malderen, R., Delcloo, A.W., Sussmann, R., Mahieu, E., Servais, C., Romanens, G., Stübi, R., Ancellet, G., Godin-Beekmann, S., Yamanouchi, S., Strong, K., Johnson, B., Cullis, P., Petropavlovskikh, I., Hannigan, J., Hernandez, J.L., Rodriguez, A.D., Nakano, T., Chouza, F., Leblanc, T., Torres, C., Garcia, O., Röhling, A., Schneider, M., Blumenstock, T., Tully, M., Paton-Walsh, C., Jones, N., Querel, R., Strahan, S., Stauffer, R.M., Thompson, A.M., Inness, A., Engelen, R., Chang, K.L., Cooper, O.R., COVID-19 Crisis Reduces Free Tropospheric Ozone across the Northern Hemisphere, Geophysical Research Letters, 48, e2020GL091987, https://doi.org/10.1029/2020GL091987.
Vigouroux, C, Blumenstock, T, Coffey, M, Errera, Q, García, O, Jones, N.B, et al. (2015). Trends of ozone total columns and vertical distribution from FTIR observations at eight NDACC stations around the globe. Atmospheric Chemistry and Physics, 15, 2915–2933. https://doi.org/10.5194/acp-15-2915-2015.
Weber, J., Shin, Y. M., Staunton Sykes, J., Archer‐Nicholls, S., Abraham, N. L., & Archibald, A. T. (2020). Minimal climate impacts from short‐lived climate forcers following emission reductions related to the COVID‐19 pandemic. Geophysical Research Letters, 47, e2020GL090326. https://doi.org/10.1029/2020GL090326.
WMO (2014), Quality assurance and quality control for ozonesonde measurements in GAW, World Meteorological Organization (WMO), Global Atmosphere Watch report series, Smit, H.G.J., and ASOPOS panel (eds.), GAW Report No. 201, 100 pp., Geneva. [Available online at https://library.wmo.int/doc_num.php?explnum_id=7167].