Detecting moisture transport pathways to the subtropical North Atlantic free troposphere using paired H2O-δ D in situ measurements
We present two years of measurements of water vapour (H2O) and its isotopologue ratio (δD, the standardized ratio between H216O and HD16O) made at two remote mountain sites on Tenerife Island in the subtropical North Atlantic. We show that the data – if measured during nighttime – are well representative for the lower/middle free troposphere. We use the measured H2O-δD pairs, together with dust measurements and back-trajectory modelling for analysing the moisture pathways to this region. We can identify four principally different transport pathways. The first two pathways are linked to transport from high altitudes and high latitudes, whereby the respective air can be dry, due to last condensation occurring at low temperatures, as well as humid, due to cross isentropic mixing with lower level and more humid air during transport since last condensation. The third pathway is transport from lower latitudes and lower altitudes, whereby we can identify rain re-evaporation as an occasional source of moisture. The fourth pathway is linked to the African continent, where during summer dry convection processes over the Sahara very effectively inject humidity from the boundary layer to higher altitudes. This so-called Saharan Air Layer (SAL) is then advected westward over the Atlantic and contributes to moisten the free troposphere. We demonstrate that different pathways leave distinct fingerprints on the measured H2O-δD pairs (see the Figure shown below).
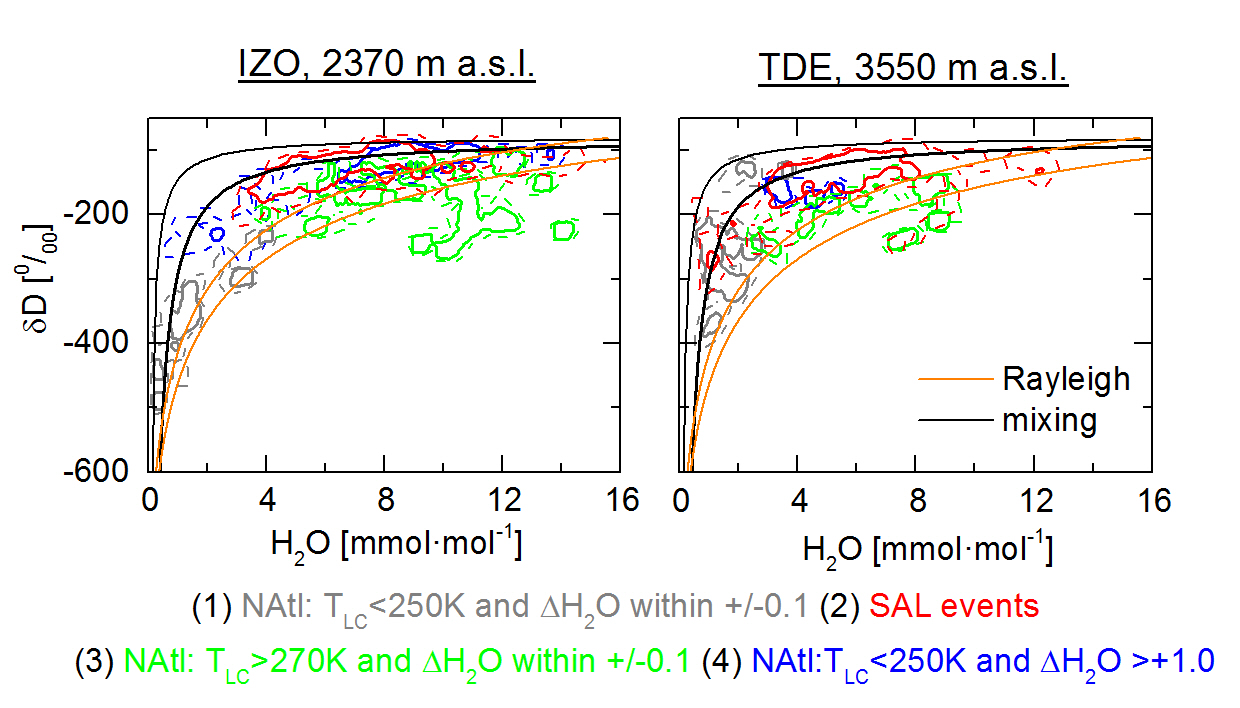
Figure. H2O-δD distributions as obtained for the four different moisture pathways that determine the free troposphere moisture budget in the surroundings of Tenerife (Left panel for IZO and right panel for TDE). Depicted are contour lines indicating the areas of the highest data point density. The thin dashed and thick solid lines mark the areas that include 95 and 66 % of all data, respectively. The different colour of the contour lines marks the different pathways (1–4) as given in the legend. Orange lines represent the evolution of an airmass that has experienced Rayleigh distillation for RH = 80 % and SST = 18 ◦C (thin line) and SST = 25 ◦C (thick line), respectively. These temperatures cover the annual mean sea surface temperatures around the Canaries. The black thin line represents the mixing between a moist airmass (initial conditions: H2O = 18 mmolmol−1 , δD = −84 ‰) and a dry airmass (initial conditions: H2O = 0.4 mmolmol−1, δD = −600‰). The black thick line represents another mixing process (initial conditions for moist end member: H2O = 16 mmolmol−1 , δD = −93 ‰; initial conditions for dry end member: H2O = 0.4 mmolmol−1, δD = −600 ‰).
The full article reference is:
González, Y., Schneider, M., Dyroff, C., Rodríguez, S., Christner, E., García, O. E.¸ Cuevas, E.¸ Bustos, J. J., Ramos, R., Guirado-Fuentes, C., Barthlott, S., Wiegele, A. and Sepúlveda, E., Detecting moisture transport pathways to the subtropical North Atlantic free troposphere using paired H2O-δD in situ measurements, Atmos. Chem. Phys. Discuss., 15, 27219–27251, 2015, www.atmos-chem-phys-discuss.net/15/27219/2015/, doi:10.5194/acpd-15-27219-2015.
It is available at: http://www.atmos-chem-phys-discuss.net/15/27219/2015/acpd-15-27219-2015.html