“Ground-based remote sensing of tropospheric water vapour isotopologues within the project MUSICA”, paper published in AMTD
Within the project MUSICA (MUlti-platform remote Sensing of Isotopologues for investigating the Cycle of Atmospheric water), long-term tropospheric water vapour isotopologues data records are provided for ten globally distributed ground-based mid-infrared remote sensing stations of the NDACC (Network for the Detection of Atmospheric Composition Change). Atmospheric water isotopologue observations are promising for investigating the atmospheric water cycle and its links to the global energy and radiation budgets. However, the observations are very demanding it is essential to assess the quality of such datasets.
In this context, this technical presents a new method for characterizing the complex nature of isotopologue remote sensing datasets. The method is applied to the ground-based FTIR dataset of MUSICA. Figure 1 shows a map of the contributing stations, ranging from the Arctic to the Antarctic. The paper documents the network-wide data consistency, that the MUSICA humidity profiles are representative for most of the troposphere, and that the isotopologue composition can be detected in the lower and middle troposphere.
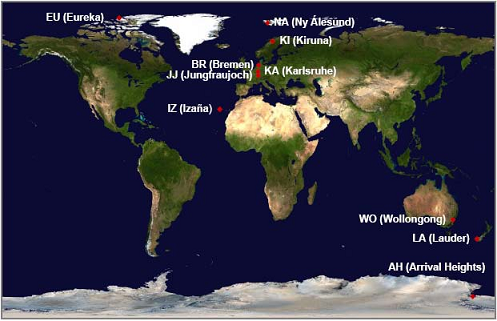
Figure 1: Map of the globally distributed ground-based NDACC-FTIR stations contributing to MUSICA.
In order to indicate the potential of such long-term isotopologue remote sensing data, the paper presents an observed and modeled climatology. We identify differences in the multi-year mean and seasonal cycles that significantly exceed the estimated errors, thereby indicating deficits in the modeled atmospheric water cycle. An example is given in Figure 2, which shows the observed and modeled intra-annual variability of H2O and δD – a normalized expression for the HDO/H2O isotopologue ratio) – with maxima in July-September (left graphs). The right graph shows a H2O-δD plot: passing from summer to winter, the troposphere is more depleted in heavy isotopologues than passing from winter to summer. Although in spring and autumn the atmospheric humidity is very similar, the humidity’s isotopic fingerprint is significantly different. This detail is not fully captured by the model, thereby indicating that the model does not reproduce all the details of the atmospheric water cycle.
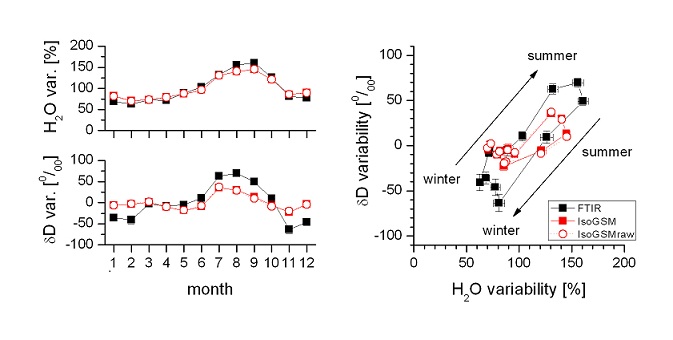
Figure 2: Isotopic fingerprint in the annual atmospheric water vapour cycle (example Izaña). Shown is the intra-annual variability of the monthly averages of H2O and the H2O/HDO ratio expressed as δD (we use data of the 1999-2011 time period). Black: FTIR observations; Red solid squares: IsoGSM (climate model) simulations smoothed by FTIR kernels; Red circles: unsmoothed IsoGSM simulations.
For more details about this work please refer to: Schneider, M., Barthlott, S., Hase, F., González, Y., Yoshimura, K., García, O. E., Sepúlveda, E., Gomez-Pelaez, A., Gisi, M., Kohlhepp, R., Dohe, S., Blumenstock, T., Strong, K., Weaver, D., Palm, M., Deutscher, N. M., Warneke, T., Notholt, J., Lejeune, B., Demoulin, P., Jones, N., Griffith, D. W. T., Smale, D., and Robinson, J.: Ground-based remote sensing of tropospheric water vapour isotopologues within the project MUSICA, Atmos. Meas. Tech. Discuss., 5, 5357-5418, doi:10.5194/amtd-5-5357-2012, 2012. Link.