Hydrometeorological year 2011-2012 has been the driest in the Izaña Observatory record
Hydrometeorological year (also known as “agricultural year” in Spain) is the period from September 1 of one year and August 31 of the following year. Hydrometeorological year should not be confused with hydrological year or precipitation year, which begins on October 1 of one year and ends on September 30 of the following year.
The precipitation collected at the Izaña Atmospheric Observatory in the recently completed hydrometeorological year 2011-2012 was 45.7 liters per square meter. This period has been the driest in the history of the Observatory, whose series started in 1916 (96 years). So, this period has been classified as an extremely dry hydrometeorological year.
Noteworthy is the low precipitation value collected, as it is almost half of that obtained in the year so far had been the driest, 1998-1999 (79.9 liters per square meter), and it is only just over 10% of average precipitation 442.2 liters per square meter. It is also significant that the driest hydrometeorological five years have occurred in the last 15 years:
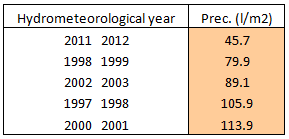
Table 1: List of hydrometeorological driest five years registered Izaña Atmospheric Observatory with the value of precipitation collected.
The following graph shows, in columns, the total annual rainfall (hydrometeorological years) at Izaña registered from the beginning of the series. One of the main features of the distribution of rainfall in this mountain observatory is its enormous year-to year variability. During few especially rainy years total precipitation exceeded 1,200 liters per square meter, while during very dry years the total precipitation only account 200 liters per square meter. Note the grouping of dry years in the 30s and 40s of the last century, and especially the late 90s, and in early first decade of this century. The rainiest years were observed in the 50s:
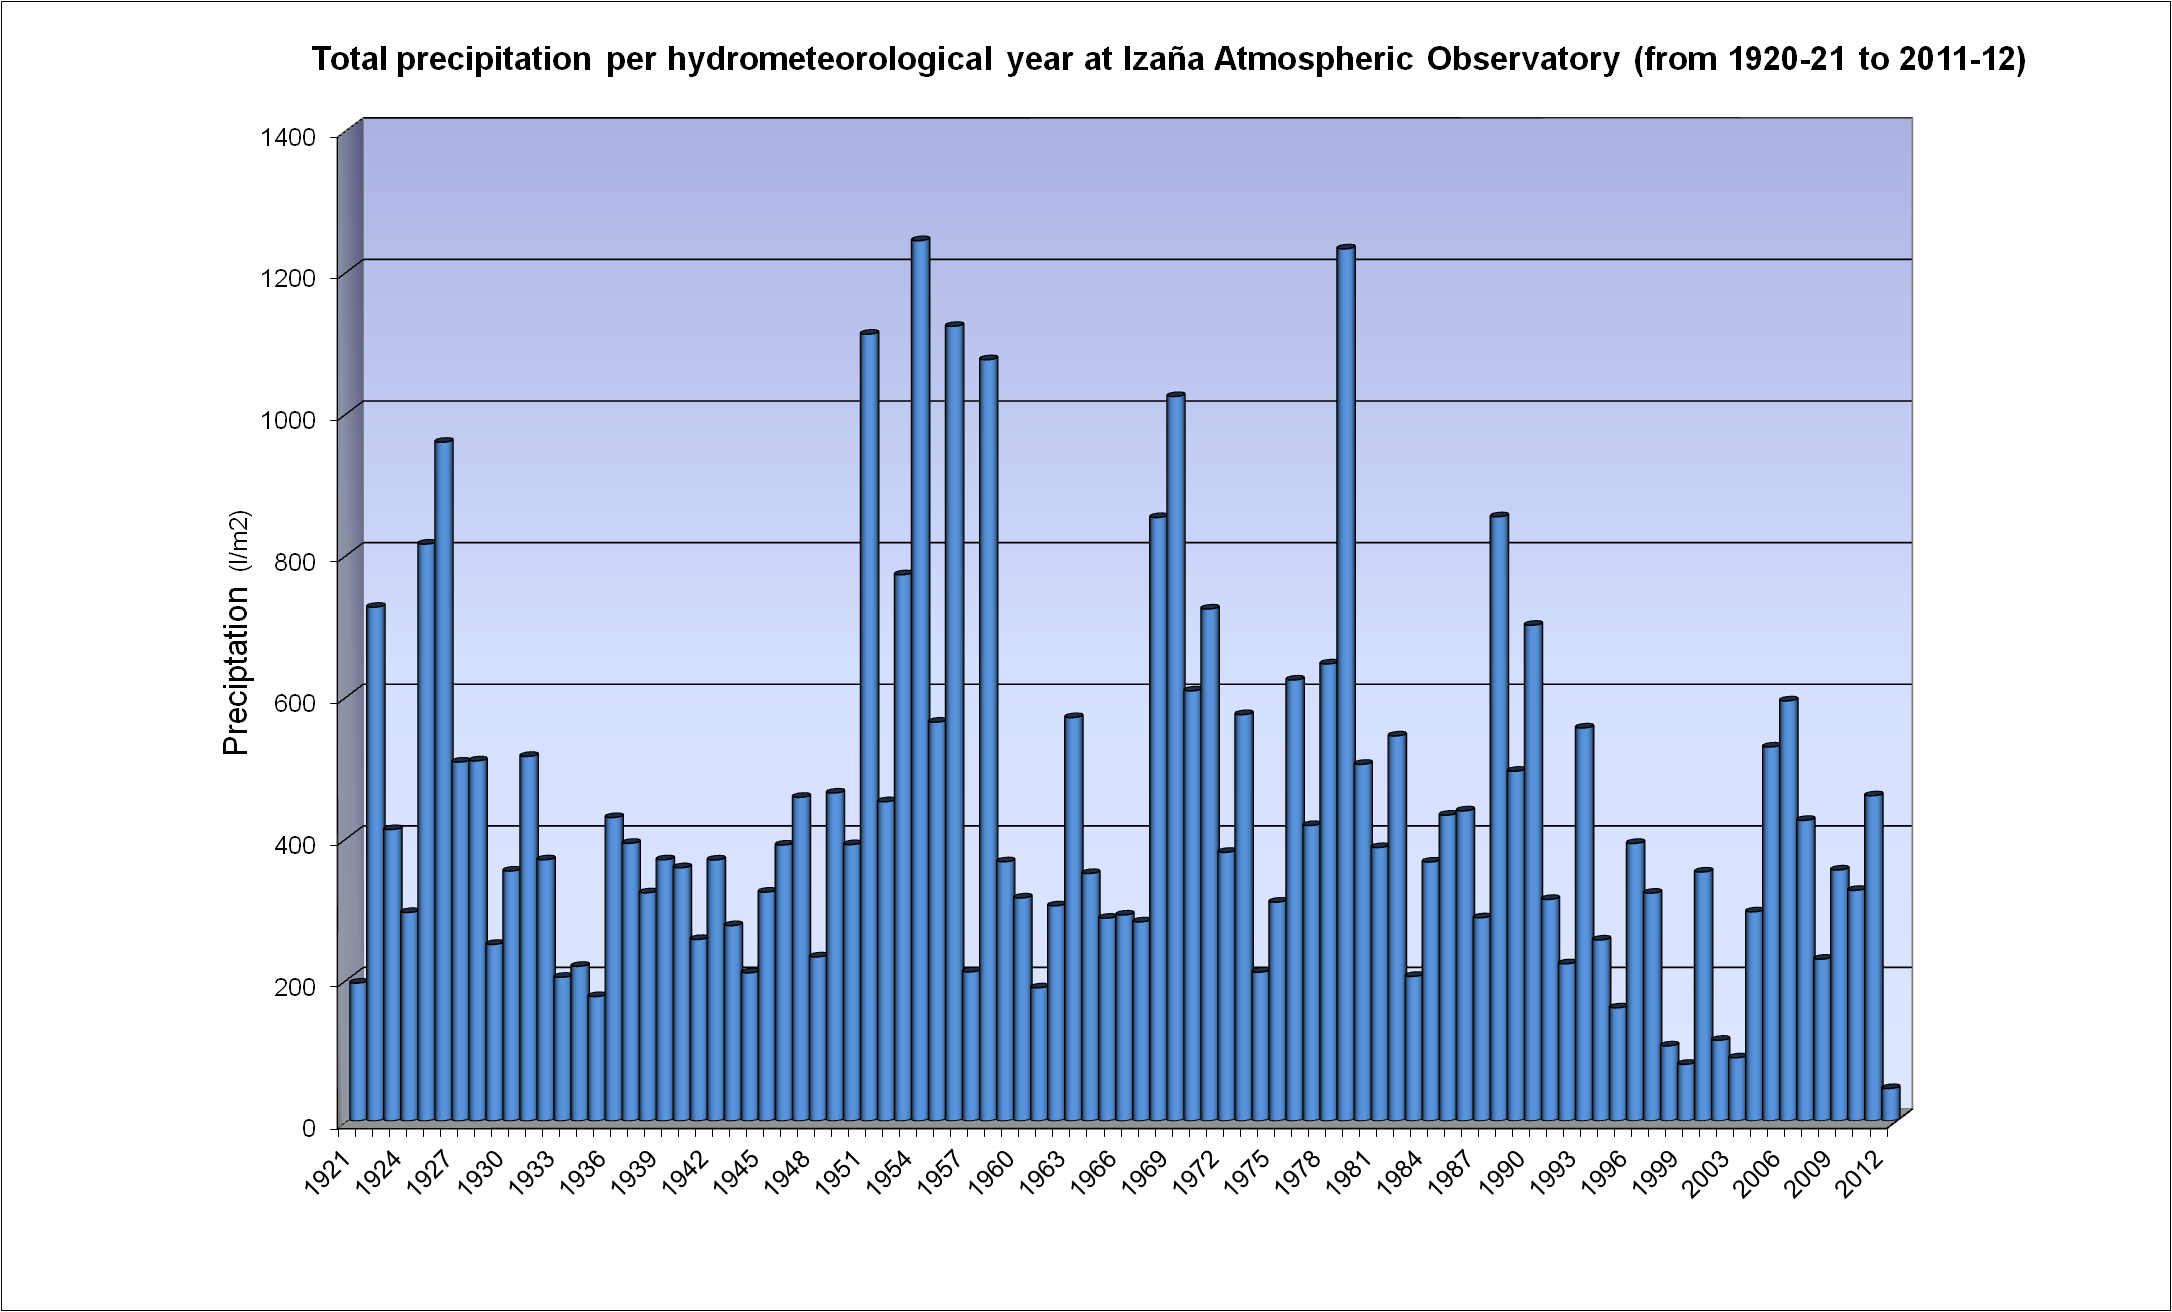
Figure 1: Annual precipitation (hydrometeorological year) at the Izaña Atmospheric Observatory.
An analysis of the monthly precipitation distribution over the past year hydrometeorological compared with the monthly average over the whole series shows that all months have been below average, except July, in which mean rainfall is zero. The largest deviations from the monthly means are observed in autumn and winter caused by the almost total absence of rainstorms and snow typical of these seasons. The last winter was the driest of the series, as explained in previous news. To see again this news, click here. In that news you can also find a brief explanation of the possible causes of a winter so dry. The deviation was lower in spring thanks to a rain episode that took place in April. The lowest deviation is observed in summer, as it is the driest season because atmospheric conditions (presence of trade winds near ground that stabilize the lower atmosphere, and a significant subsidence driven by the proximity of the Azores anticyclone) which significantly difficult the emergence of cloudiness with precipitation capacity.
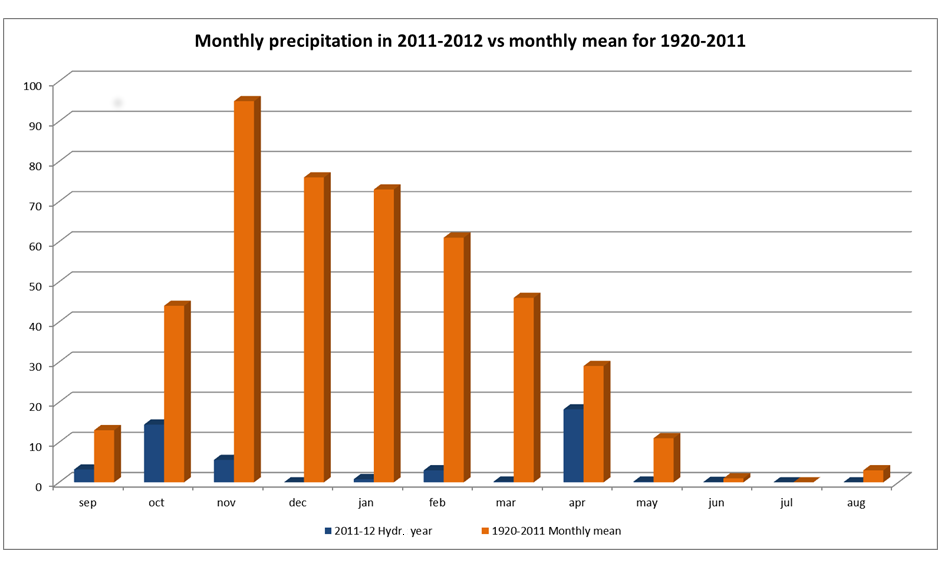
Figure 2: Comparison of monthly precipitation in the hydrometeorological year 2011-2012 compared with monthly means averaged in the period 1920-2011.
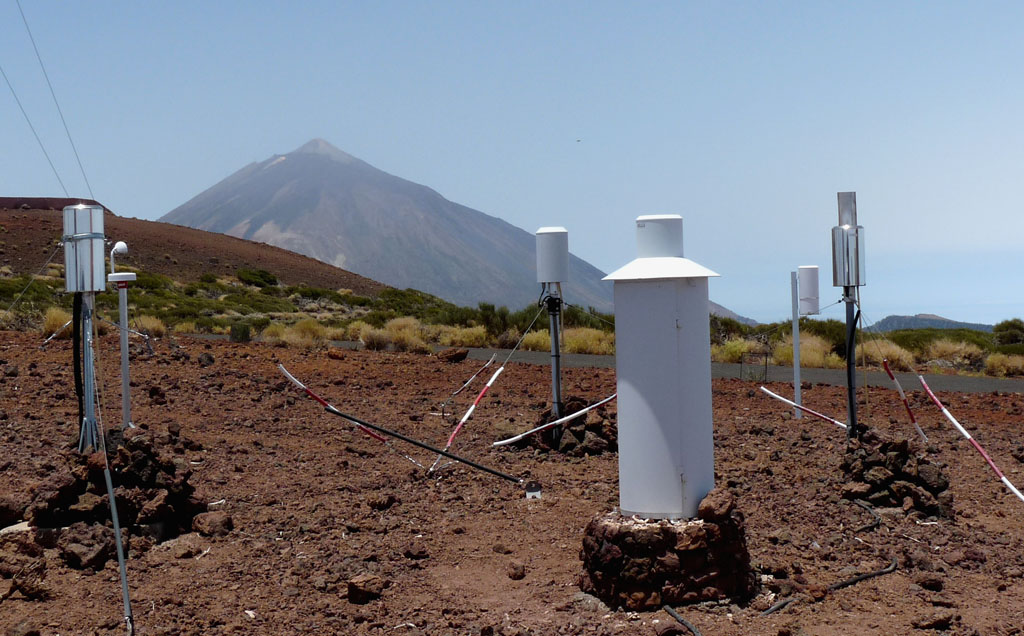
Besides conventional precipitation (due to rain, drizzle and snow) in arid areas is of great importance to know the occult or horizontal precipitation, that caused by attracting the fog droplets by vegetation. When the mass of cool, moist air is transported to Canary by trade winds encounters the reliefs of islands and is forced to ascend producing air condensation. The altitude where we normally observe horizontal precipitation is that within the range where stratocumulus clouds are blocked by the orography of mountainous islands (from about 1,000 meters to 1,600 meters in winter and from about 700-1200 meters in summer) that is the altitude range where the vegetation takes this water resource. Although Izaña Observatory is generally well above this cloud layer (2,367 meters), at times the observatory is found within the cloud, especially in winter. We installed a rain gauge to measure hidden precipitation in 2009 (you can see the news here). The records of this year show a decrease in fog water collection (due to a lower presence of cloudiness at the Observatory level). We have collected almost half occult precipitation that of the hydrometeorological year 2010-2011. However, comparing this value with that of conventional precipitation the difference is much greater, on the order of 13 times, what indicated the great importance of this water resource especially in very dry years like the last one.
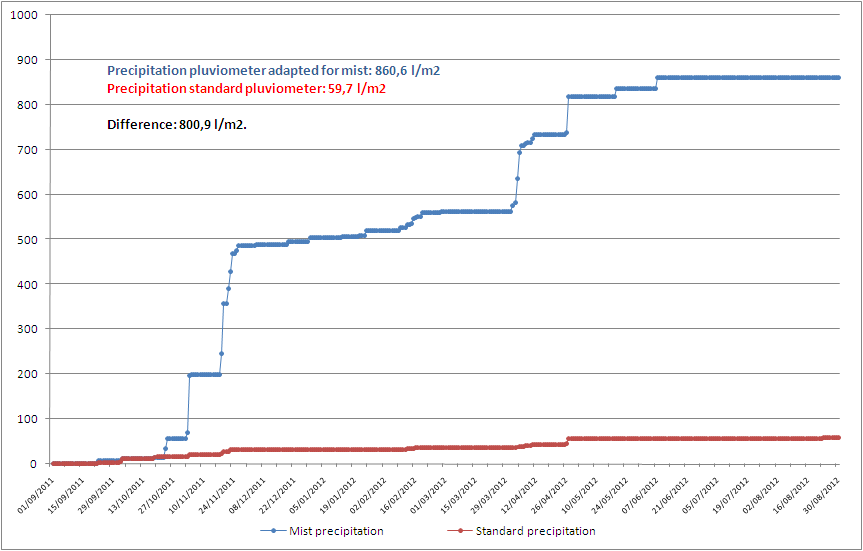
Figure 3: Evolution of precipitation collected with conventional rain and fog gauges. The precipitation due to fog (occult or horizontal precipitation) is obtained from the difference between the values given by both gauges.