
Izaña Observatory registers a new record in the atmospheric CO2 concentration, while the presence of other greenhouse gases in the atmosphere continues to increase

Clic here for spanish version
Carbon dioxide (CO2) is the main greenhouse gas responsible for global warming and climate change. Since the beginning of the industrial revolution, anthropogenic emissions have caused that its atmospheric concentration has steadily increased from 280 ppm to current records [1]. In May 2023, measurements at the Izaña Observatory (IZO) indicate that its monthly average concentration was 423.86 ppm (parts per million). This value is the new maximum of the Izaña Observatory time series and represents an increase of 2.91 ppm with respect to the previous maximum, 421.95 ppm, recorded in April 2022. The Mauna Loa Observatory (MLO, Hawaii, NOAA), whose record series began in 1958 and is a global reference, has reported that the monthly mean concentration for May was 424.00 ppm [2]. Although, these data are provisional, the final records will not differ significantly from these. IZO and MLO, although separated by more than 13,000 km, are part of a small group of high mountain stations whose measurements, for a large part of the day, are representative of the background atmospheric composition. These observatories are characterised by the fact that they are located in places not directly affected by anthropogenic pollution sources, allowing them to accurately measure long-term changes in the background atmospheric composition.
Figure 1 shows the monthly average CO2 concentration recorded at IZO since the beginning of its continuous measurement programme in 1984. In this series of records, on the one hand, a seasonal cycle associated with CO2 exchange between the atmosphere and the biosphere can be identified, and on the other hand, an annual trend of increasing background concentration due to anthropogenic emissions. The annual cycle shows a maximum concentration in spring (April and May) and then decreases due to the high CO2 absorption caused by the photosynthetic activity of the vegetation as it develops. The arrival of autumn and the beginning of the loss of vegetation cover produce the opposite effect, generating a release of CO2 into the atmosphere (see the enlarged graph in Figure 1).
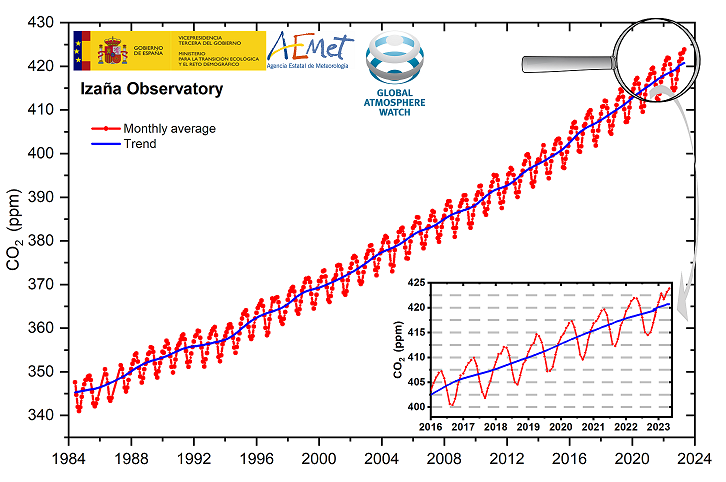
Figure 1. Monthly mean (red dots) and trend (blue line) of CO2 concentration at IZO. The enlargement shows the concentrations in the period 2016-2023.
Since 1984, the greenhouse gas and carbon cycle research programme implemented at IZO continuously monitors the background concentration of methane (CH4). In 2007, the measurement programme was extended to two other gases: nitrous oxide (N2O) and sulphur hexafluoride (SF6). IZO also participates as an air sampling station (flask) in the global network implemented by NOAA [3-5].
As Figure 2 shows, the average concentration of CH4, N2O y SF6 is several orders of magnitude lower than CO2. However, they are characterised by warming potentials 28, 265 and 23,500 times higher than CO2 [2], making them radiatively much more efficient than CO2 in heating the atmosphere. Consequently, in recent decades, they have been increasingly monitored globally, especially since pre-industrial concentrations of CH4 and N2O were 0.7 and 0.27 ppm, respectively. Meanwhile, the presence of SF6 in the atmosphere is exclusively due to anthropogenic emissions since the industrial revolution [2].
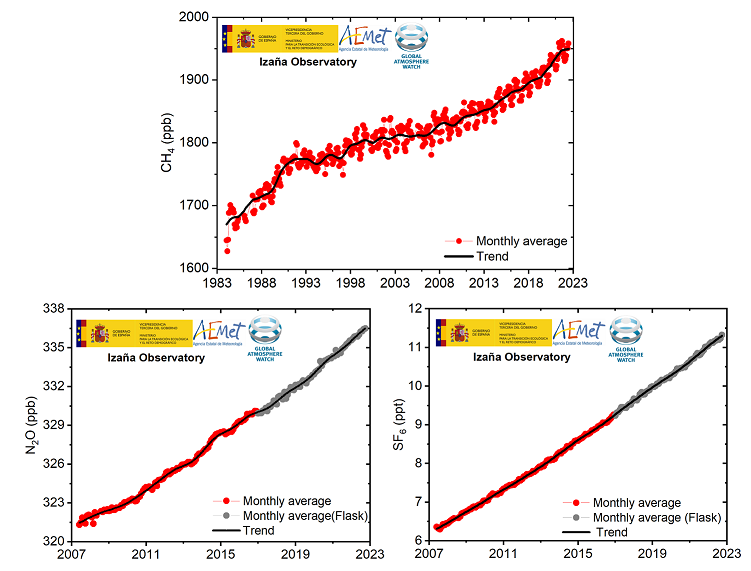
Figure 2. Monthly mean (red dots) and trend (black line) of CH4, N2O and SF6 concentration at IZO. Air samples (flask) are processed by NOAA.
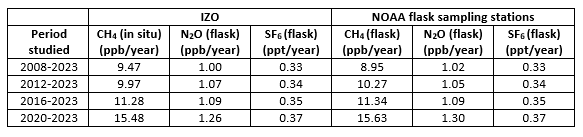
The IZO records and the global average obtained from all NOAA flask sampling stations indicate that the annual increase of these gases in the atmosphere is accelerating, as shown in Table 1 [3-5]. Analyzing only the last few years, CH4 has doubled its rate of increase compared to that calculated for the whole period. Similarly, the concentration of N2O has accelerated greatly in recent years. The good agreement between the interannual increases in the concentration of these components recorded at the Izaña Observatory and the averages obtained at the NOAA stations (presented in Table 1) indicates that the observations at IZO are representative of the increase in the concentration of these gases on a global scale.
Table 1. Interannual variations of CH4, N2O and SF6 concentration in IZO and globally for different periods since 2008. The interannual variations are calculated as the difference between the trends values on 1 January of the period analysed.
IZO and MLO are part of the Global Atmosphere Watch Programme of the World Meteorological Organization (WMO-GAW). IZO has been incorporated as an atmospheric station into the Integrated Carbon Observing System (ICOS), the European Commission’s infrastructure for the observation and monitoring of greenhouse gases.
References:
[1] https://gml.noaa.gov/ccgg/trends/
[2] IPCC, 2022: Climate Change 2022: Impacts, Adaptation, and Vulnerability. Contribution of Working Group II to the Sixth Assessment Report of the Intergovernmental Panel on Climate Change [H.-O. Pörtner, D.C. Roberts, M. Tignor, E.S. Poloczanska, K. Mintenbeck, A. Alegría, M. Craig, S. Langsdorf, S. Löschke, V. Möller, A. Okem, B. Rama (eds.)]. Cambridge University Press. Cambridge University Press, Cambridge, UK and New York, NY, USA, 3056 pp., doi:10.1017/9781009325844.
[3] https://gml.noaa.gov/ccgg/trends_ch4/