New paper published in Atmospheric Chemistry and Physics Discussion entitled “Trends of ozone total columns and vertical distribution from FTIR observations at 8 NDACC stations around the globe” by Vigouroux et al.

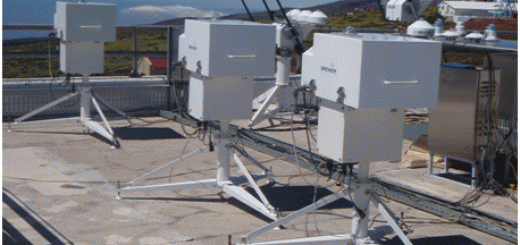
This paper aims at analysingthe total and vertical ozone trends and variability by using eight of the Network for the Detection of Atmospheric Compososition Change (NDACC) stations having a long-term time series of ozone measured by the FTIR technique (Fourier Transform Infrared), namely: Ny-Alesund (79° N), Thule (77° N), Kiruna (68° N), Harestua (60° N), Jungfraujoch (47° N), Izaña (28° N), Wollongong (34° S) and Lauder (45° S). The length of the FTIR time-series varies by station, but is typically from about 1995 to present. This work applies to the monthly means of the ozone total and four partial columns a stepwise multiple regression model including the following proxies: solar cycle, Quasi-Biennial Oscillation (QBO), El Niño-Southern Oscillation (ENSO), Arctic and Antarctic Oscillation (AO/AAO), tropopause pressure (TP), equivalent latitude (EL), Eliassen-Palm flux (EPF), and volume of polar stratospheric clouds (VPSC).
At the Arctic stations, the trends are found mostly negative in the troposphere and lower stratosphere, very mixed in the middle stratosphere, positive in the upper stratosphere due to a large increase in the 1995–2003 period, and non-significant when considering the total columns (see Table 1). The trends for mid-latitude and subtropical stations are all non-significant, except at Lauder in the troposphere and upper stratosphere, and at Wollongong for the total columns and the lower and middle stratospheric columns; at Jungfraujoch, the upper stratospheric trend is close to significance (+0.9±1.0 % decade−1). Therefore, some signs of the onset of ozone mid-latitude recovery are observed only in the Southern Hemisphere, while a few more years seems to be needed to observe it at the northern mid-latitude stations.
| FTIR station | Location | Tropos | Lower Stratos | Middle Stratos | Upper Stratos | Total Column |
| Ny-Alesund 1995 | 79ºN, 12ºE, 0.02 | -5.8±3.2 | -4.2±3.1 | -5.5±3.8 | +6.7±5.3 | -3.0±1.5 |
| Thule 1999 | 77ºN, 69ºW, 0.22 | -5.3±4.4 | -0.4±6.3 | +0.2±4.4 | -2.3±6.5 | -2.1±2.6 |
| Kiruna 1996 | 68ºN, 20ºE, 0.42 | -0.9±2.5 | -3.9±2.6 | +0.4±2.6 | +7.4±3.4 | -0.3±1.6 |
| Harestusa 1995 | 60ºN, 11ºE, 0.60 | -3.1±2.0 | -5.3±4.6 | +4.8±4.3 | +7.8±5.5 | +1.0±2.2 |
| Jungfraujoch 1995 | 47ºN, 8ºE, 3.58 | -2.5±2.7 | -0.5±3.3 | -0.6±1.2 | +0.9±1.0 | -0.4±1.2 |
| Izaña 1999 | 28ºN, 16ºW, 2.37 | +0.7±2.8 | -1.7±2.2 | -0.1±2.0 | +1.6±2.6 | +0.5±1.2 |
| Wollongong 1996 | 34ºS, 151ºE, 0.03 | -2.2±2.8 | +3.1±2.7 | +4.0±2.0 | +0.2±1.6 | +1.9±1.1 |
| Lauder 2001 | 45ºS, 170ºE, 0.37 | +7.7±3.5 | -3.8±4.1 | -0.2±3.5 | +2.8±2.4 | -0.3±1.8 |
Table 1. Annual trends (in %/decade) and their 95% uncertainty ranges for all stations used in this study. Trends indicated in bold are significant. The location of the stations (Latitude, Longitude and Altitude in km a.s.l.) is also shown.
For more details, please refer to: Vigouroux, C., Blumenstock, T., Coffey, M., Errera, Q., García, O., Jones, N. B., Hannigan, J. W., Hase, F., Liley, B., Mahieu, E., Mellqvist, J., Notholt, J., Palm, M., Persson, G., Schneider, M., Servais, C., Smale, D., Thölix, L., and De Mazière, M.: Trends of ozone total columns and vertical distribution from FTIR observations at 8 NDACC stations around the globe, Atmos. Chem. Phys. Discuss., 14, 24623-24666, doi:10.5194/acpd-14-24623-2014, 2014.
http://www.atmos-chem-phys-discuss.net/14/24623/2014/acpd-14-24623-2014.html