NEW PUBLICATION: Quantifying uncertainty in carbon monoxide measurements at the Izaña global GAW station (2008-2011)
This new study has been published in Atmospheric Measurement Techniques Discussions (link to the article). Carbon monoxide at Izaña observatory is measured using a Reduction Gas Analyser. The measurement system configuration, the instrumental response function (see figure 1), the calibration scheme, the data processing, the Izaña’s 2008-2011 CO nocturnal time series (see figure 2), and the mean diurnal cycle by months are presented (see Figure 3).
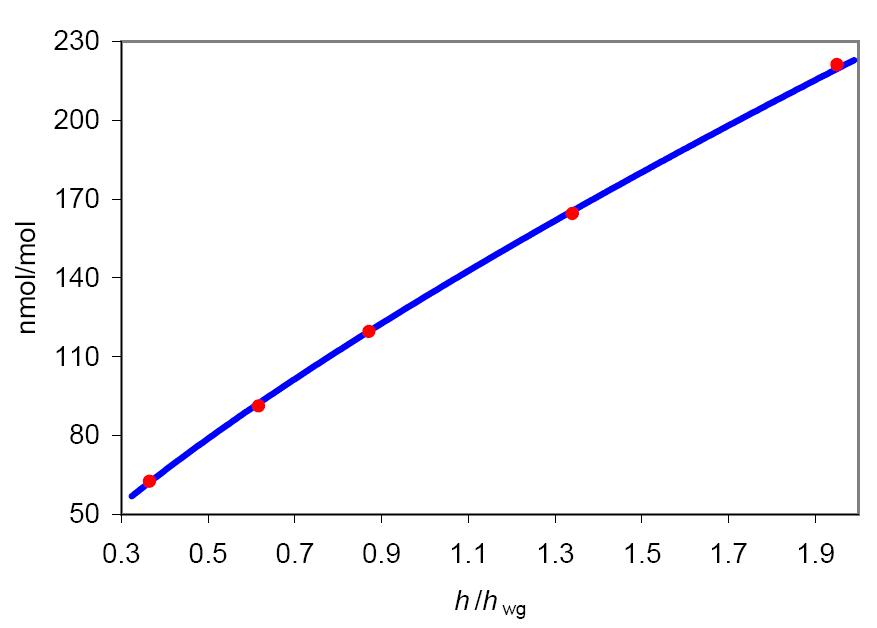
Figure 1. Least-squares fitting of a typical calibration which uses 5 standards. The response function used is a potential function in relative chromatographic peak height.
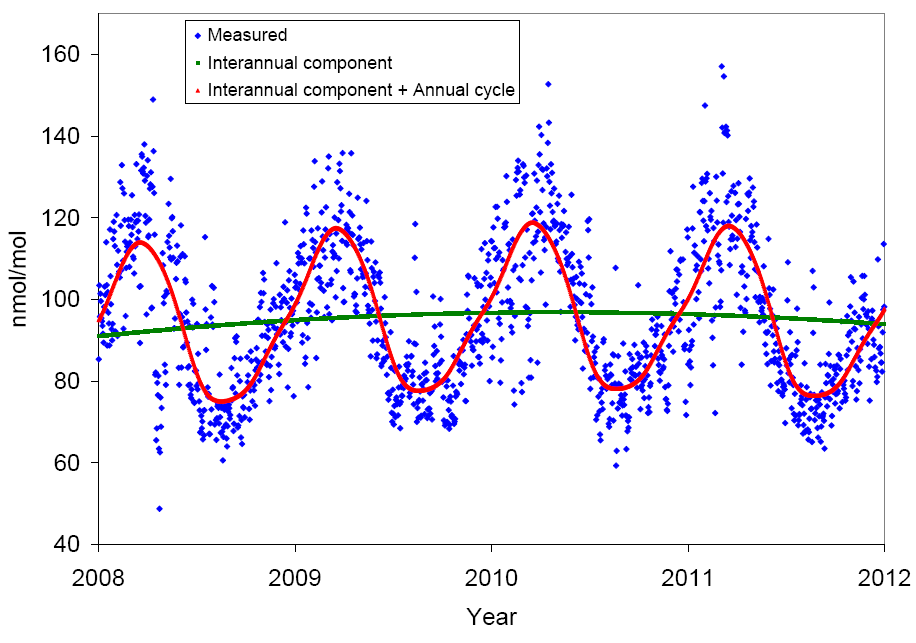
Figure 2. Daily night means (20:00-08:00 UTC; in this time period, conditions are of free troposphere) for the carbon monoxide mole fraction measured at Izaña Observatory (blue squares). Fitted interannual component (green curve) and fitted annual cycle superposed (red curve).
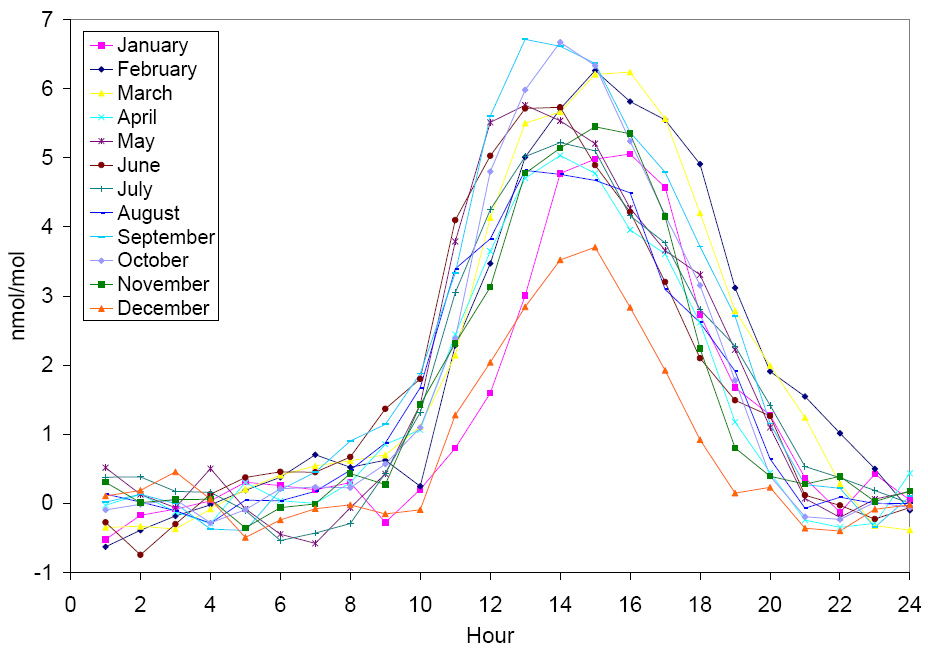
Figure 3. Carbon monoxide mean diurnal cycle relative to the nocturnal background level. CO is typically stable during the night period, and reaches a maximum around 13:00-15:00 UTC due to the arrival of contaminated air with the upslope thermal wind which occurs during daylight time.
A rigorous uncertainty analysis (error analysis) for CO measurements carried out at the Izaña station, which could be applied to other GAW stations, has been developed. The combined standard uncertainty is determined from four uncertainty components (see Figure 4): uncertainty of the WMO standard gases interpolated over the range of measurement, the uncertainty that takes into account the agreement between the standard gases and the response function used, the uncertainty due to the repeatability of the injections, and the propagated uncertainty related to the response function parameters uncertainties. The mean value of the combined standard uncertainty decreased significantly after March 2009, from 2.37 nmol/mol to 1.66 nmol/mol, due to improvements in the measurement system. A fifth type of uncertainty we call representation uncertainty is considered when some of the data necessary to compute exactly the mean are absent.
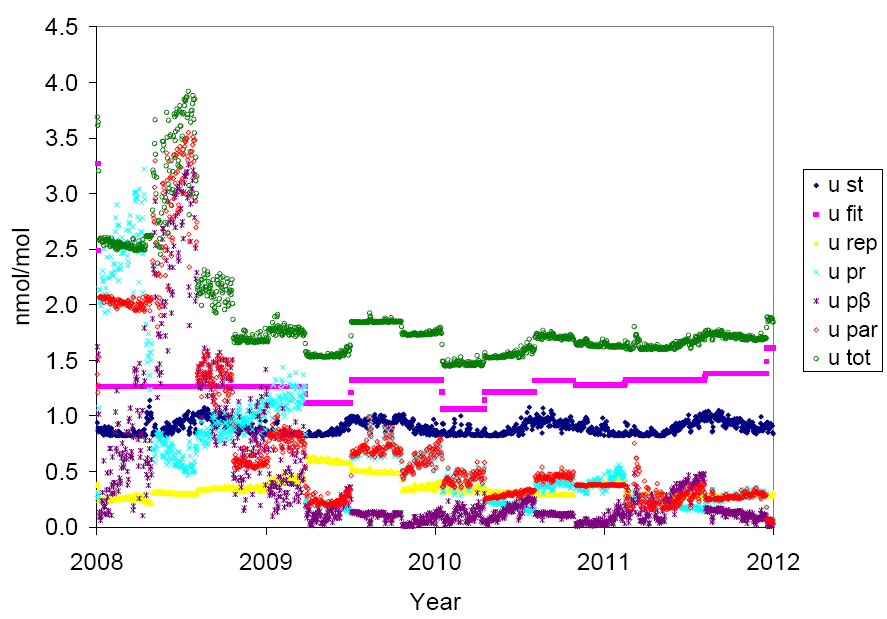
Figure 4. Uncertainty components (and subcomponents) of the measured CO mole fraction.
In-situ hourly means are compared with simultaneous and collocated NOAA flask samples. The uncertainty in the differences is determined (see figure 5) and whether these are significant. For 2009-2011, only 24.5 % of the differences are significant, and 68 % of the differences are between -2.39 and 2.5 nmol/mol. The annual mean differences for 2009-2011 are well within the 2 nmol/mol compatibility goal of GAW.
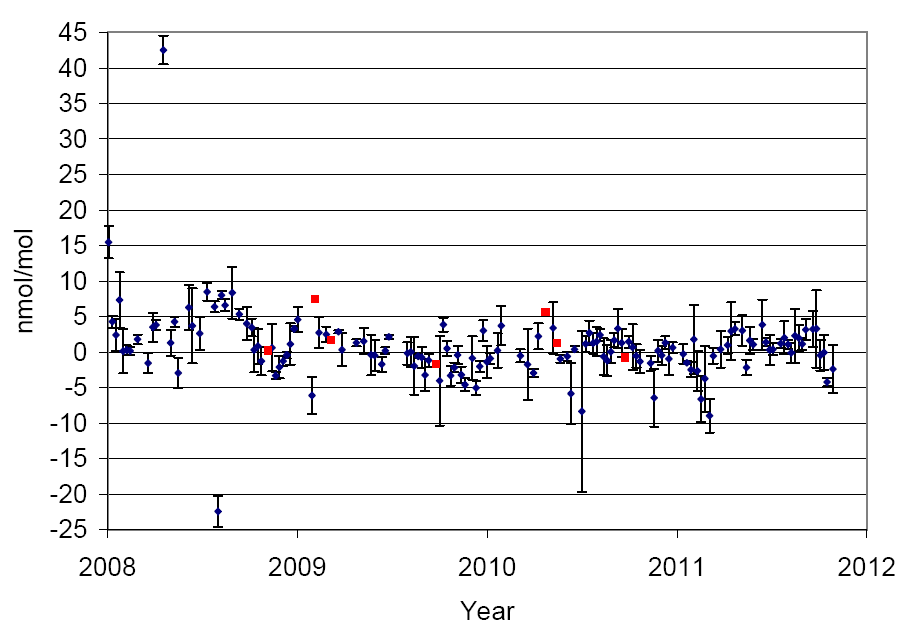
Figure 5. Differences between NOAA flask samples and simultaneous in-situ hourly means. Error bars indicate comparison uncertainty.