Process-evaluation of tropospheric humidity simulated by general circulation models using water vapour isotopologues.

The water vapour stable isotopic composition is affected by fractionation during phase changes. Measurements of water vapour isotopologues therefore provide complementary information on the water budget when combined with humidity, because they record the integrated history of phase changes within a given air mass. In this context, two new papers, published recently in the Journal of Geophysical Research, examine how H2O and HDO measurements in water vapour can be used to detect and diagnose biases in the representation of processes controlling tropospheric humidity in atmospheric general circulation models (GCMs). Removing these biases is essential for improving the reliability of climate projections.
The first paper analyzes the level of consistency of different data sets. Figure 1 shows the latitudinal gradients of δD (a normalized expression for the ratio between two water isotopologues: HDO/H2O) derived from the data sets used: 5 surface and 3 aircraft in-situ data sets and from 4 satellites and 16 ground-based remote-sensing data sets. The latter bases on Fourier Transform (FTIR) spectrometer observations from the TCCON network and the MUSICA project (please note that the Izaña Atmospheric Research Centre is a leading contributor to the MUSICA project). From these data it has been shown, for instance, that the δD seasonality in the subtropics and mid latitudes (with higher δD in summer) is consistently observed in all data sets and at all tropospheric levels. The data sets have been used to evaluate the isotopic GCM called LMDZ (Laboratoire de Météorologie Dynamique-Zoom). It has been found that the model has some robust biases compared to all data sets, such as the underestimated seasonality in the subtropics. In addition, 7 GCMs from the SWING2 (Stable Water INtercomparison Group phase) project have been compared. It has been shown that there are large discrepancies between models regarding important features of the water vapour isotopic distribution: meridional gradient, seasonality, and spatial contrasts in the tropics. This suggests that water vapour isotopic measurements could be used to efficiently discriminate models regarding their representation of the processes controlling relative humidity. Furthermore, it has been shown that differences in isotopic behaviour are not obviously linked to differences in simulated humidity, confirming that water vapour isotopic composition provides additional information compared to humidity measurements.
For the second paper the Izaña MUSICA data have been of particular importance. This paper exploits the information provided by the combination of water vapour isotopic measurements to understand the cause of the moist bias in GCMs in the upper troposphere of the tropics and subtropics. Understanding this bias is very important for reliable climate projections since in the subtropical upper troposphere water vapour is a very powerful greenhouse gas. Applying the developed isotopic diagnostic suggests that excessive diffusion during vertical advection is the most frequent cause of moist biases in current GCMs. This indicates that the problem of the models’ upper tropospheric moist bias can be solved by improving the advection scheme, or alternatively by increasing the models’ vertical resolution. Thereby, this paper demonstrates that reliable climate models require a high vertical resolution of the simulated atmosphere.
For more details about these works please refer to:
1. Risi, C., Noone, D., Worden, J. Frankenberg, C., Stiller, G., Kiefer, M., Funke, B., Walker, K., Bernath,P., Schneider, M., Wunch, D., Sherlock,V., Deutscher, N., Griffith, D., Wennberg, P.O., Strong, K., Smale, D., Mahieu, E., Barthlott, S. Hase, F., García, O., Notholt, J., Warneke, T., Toon, G., Sayres, D., Bony, S., Lee, J., Brown, D., Uemura, R., y Sturm, C.: Process-evaluation of tropospheric humidity simulated by general circulation models using water vapor isotopologues: 1. Comparison between models and observations, J. Geophys. Res., 117, D05303, doi:10.1029/2011JD016621, 2012a. Link: http://www.agu.org/pubs/crossref/2012/2011JD016621.shtml
2. Risi, C., Noone, D., Worden, J. Frankenberg, C., Stiller, G., Kiefer, M., Funke, B., Walker, K., Bernath,P., Schneider, M., Bony, S., Lee, J., Brown, D. and Sturm, C.: Process-evaluation of tropospheric humidity simulated by general circulation models using water vapor isotopic observations: 2. Using isotopic diagnostics to understand the mid and upper tropospheric moist bias in the tropics and subtropics, J. Geophys. Res., 117, D05304, doi:10.1029/2011JD016623, 2012b. Link: http://www.agu.org/pubs/crossref/2012/2011JD016623.shtml
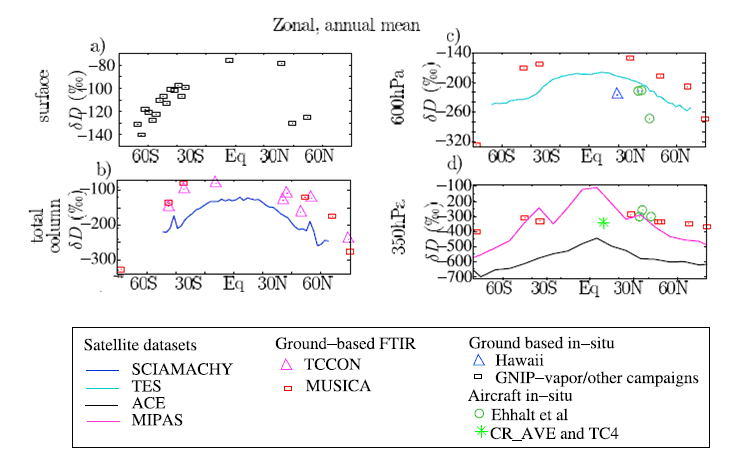
Figure 1. Synthesis of all data sets used in this study [from Risi et al., 2012a]. Zonal, annual mean observed δD at different levels. (a) At the surface, using in situ measurements (black squares). (b) Total column, using the SCIAMACHY satellite data set (blue line) and ground-based FTIR measurements from MUSICA (red squares) and TCCON (pink triangles) networks. (c) At 600 hPa, using the TES satellite data set (cyan line), ground-based FTIR measurements from MUSICA network (red squares), in situ measurements from Hawaii (at 680 hPa: blue triangle) and samples collected by aircraft by Ehhalt [1974] (green circles). (d) At 350 hPa (actually average between 320 and 380 hPa), using the MIPAS (purple line) and ACE (black line) satellite data sets, ground-based FTIR measurements from MUSICA network (red squares) and in situ measurements collected by aircraft by Ehhalt, [1974] (green circles) and during the CR-AVE and TC4 campaigns (green stars).