The month of May brought a late snowfall and low temperatures at Izaña
In the early hours of the morning on May 1 2011, it snowed around the Izaña Atmospheric Observatory and, although snow was forecast, the date on which it fell was a surprise. Although not an extraordinary phenomenon, it is not common to see snowfalls on high ground on Tenerife in the month of May: the average number of days with snow in May in the period 1961-1990 is 0.4. The mass of cold air was accompanied by very strong winds (gusts of up to 128 Km/h were registered) and low temperatures: the minimum temperature for May 1 was -3.9ºC and the maximum 1.6ºC. We have to go back as far as 1993 to find such low values in the month of May. The average temperature on that day (-1.2ºC) is the fourth lowest registered at the Izaña Observatory in the month of May in a series of more than 90 years.
The snowfall left scenes more reminiscent of winter than mid spring. The following are some examples:
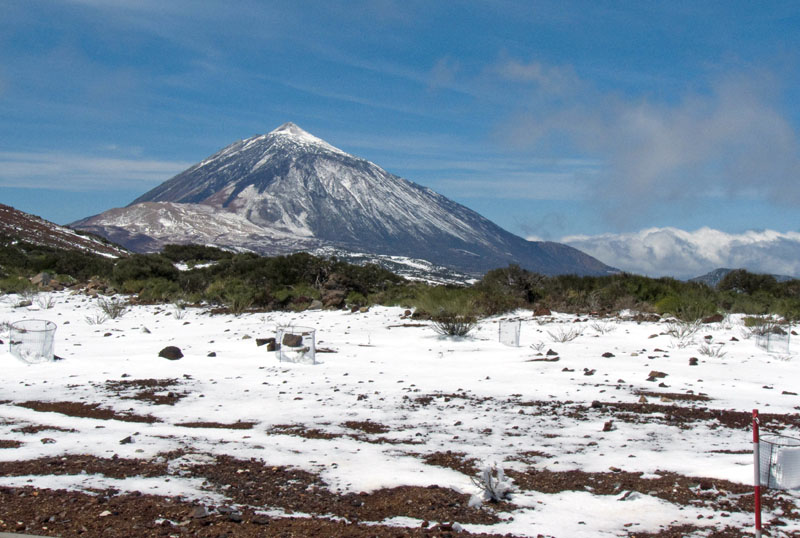
Figure 1: As always, the centre of attention after a snowfall is Teide

Figure 2: The access road to the Izaña Observatory from the TF-24. In some places the snow was more than 10 cm deep.
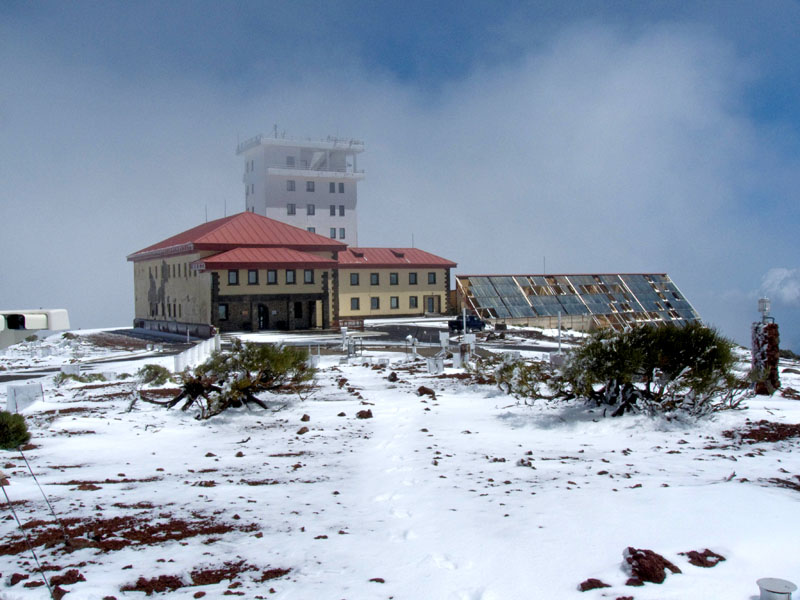
Figure 3: View of the observatory from the meteorological station hut. In spite of the rising sun, temperatures were so low that the snow lay for several hours, even though we are in May.
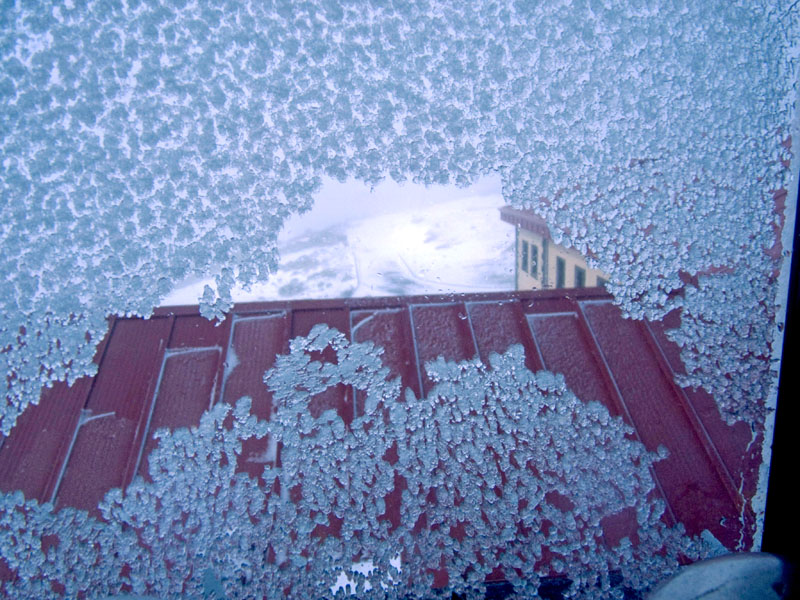
Figure 4: A curious image: accumulated ice on the glass window of one of the laboratories in the Observatory tower with a gap you can see the outside through.
The Güimar sonde on May 1 at 0 hours UTC shows there was quite a damp and unstable atmospheric layer. The isotherm at 0ªC was clearly below the Izaña Observatory at that time at 2,126 metres, which explains the presence of snow and the low temperatures.
Figure 5: Graph of the Güimar atmospheric sonde on May1 at 0 hours UTC.
On the pressure map at sea level and at a temperature of 850 hPa on May1 at 0 hours UTC, the nucleus of an area of low pressure SW of the Iberian peninsula can be seen. Its position, together with that of the area of anticyclone in the Atlantic to the west of the Azores, drew a very cold air mass from northern latitudes: at 850 hPa the temperature was about 6ºC, which is rather low for the time of year. On the topography and 500 hPa temperature map a trough can be seen, whose cold nucleus was located to the north of the archipelago. It all caused atmospheric instability and there were heavy showers in most of the islands, in some cases very heavy and on high ground (the peaks of Tenerife, as already described, but also on the peaks of La Palma) as snow.
Figure 6: Upper: air pressure at sea level and at a temperature of 850 hPa. Lower: Topography and temperature of 500 hPa.
To finish, the following graph shows the evolution of the temperature and wind speed during May 1. It can be observed that the temperature stayed very low throughout the day; the sudden increase in wind speed was due to the fact that the graph is based on data obtained from a cup wind anemometer, whose mechanism was frozen most of the day, until temperatures rose above freezing. To avoid these problems, at Izaña there are ultrasonic wind anemometers, which are not affected by the accumulation of ice.
Figure 7: Temperature and wind speed graphs obtained from the SOSS station installed at the Izaña Observatory.
Figure 8: Graph of the average wind speed per minute at the Izaña Observatory, obtained with an ultrasonic wind anemometer not affected by the accumulation of ice as it is not built with moving parts.