
Main Scientific Goals
- Long term water vapour monitoring and its relationship with climate change through:
-
- High quality observations of precipitable water vapour (PWV) total column content and vertical profile with different methodologies.
- Study of monthly, seasonal and annual mean series, analysing their homogeneity and evaluating their anomalies and evolution over time to detect possible trends.
- Analysis of intra-hourly variability as well as daily and annual mean cycles of PWV for different locations and altitudes of the Canary archipelago.
- Estimation of radiative forcing due to water vapour.
Instrumentation and Measurements
Several measurement techniques are used in this programme. Figure 1, shows an overview of some of the techniques and instruments involved in water vapour measurement.
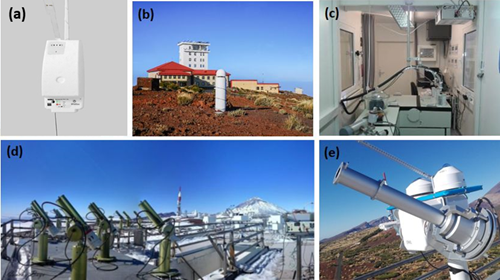
Figure 1: (a) Väisala RS41 radiosonde, (b) GNSS receiver, (c) FTIR spectrometer, (d) CIMEL sunphotometers and (e) EKO MS-711 spectroradiometer installed at Izaña Observatory.
Radiometric technique
The radiometric technique to obtain the total precipitable water vapour content in the atmospheric column consists of measuring the direct solar or lunar radiation reaching the optics of a photometer in narrow band channels around 941 nm where the absorption of infrared energy of the water vapour present in the atmosphere is significant. Bouguer-Lambert-Beer law is the basis for obtaining water vapour content from visible and infrared direct solar or lunar radiation applying the Langley-modified technique. From this technique, we can obtain the extraterrestrial irradiances for 941 nm and extract the corresponding calibration constant of the radiometer channel. At IZO, this technique is applied with a solar and lunar photometer CIMEL CE318T belonging to the AERONET (AErosol RObotic NETwork) since 2003 and with a spectroradiometer EKO MS711 since 2016. These radiometers are mounted over trackers which align the optics of the instruments towards the light source (solar or lunar disc) that corresponds to the type of photometer.
On the other hand, it is also possible to determine the amount of water vapour present in the atmospheric column by infrared spectrophotometry. Initially, an IFS 120M model FTIR (Fourier Transform Infrared Radiometer) installed at IZO from 1999 to 2005 and then an IFS 120 / 5HR model from 2005 to the present, are the instruments used that apply this technology. These instruments are based on the Michelson interferometer to determine from the interferogram corresponding to the infrared absorption spectrum of atmospheric water vapour the decrease of such radiation by absorption which is related to the water vapour content.
RS92 and RS41 Vaisala radiosondes
From the vertical profiles of relative humidity obtained with radiosondes, precipitable water content in the atmospheric column in mm is calculated by integrating numerically (using the trapezoidal rule) the density function of atmospheric water vapour for the base and top of each atmospheric stratum (Romero-Campos et al., 2012).
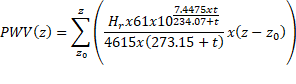
Where, is the relative humidity (%) and t is the temperature (°C). The integration is performed from ground level to 12 km altitude. By default, the PWV profile is supplied for the following layers: 1) from ground up to 1.5 km; 2) from 1.5 km to 3 km altitude in layers of 0.5 km thickness; 3) from 3 km altitude up to 12 km in layers of 1 km thickness (Figure 2).
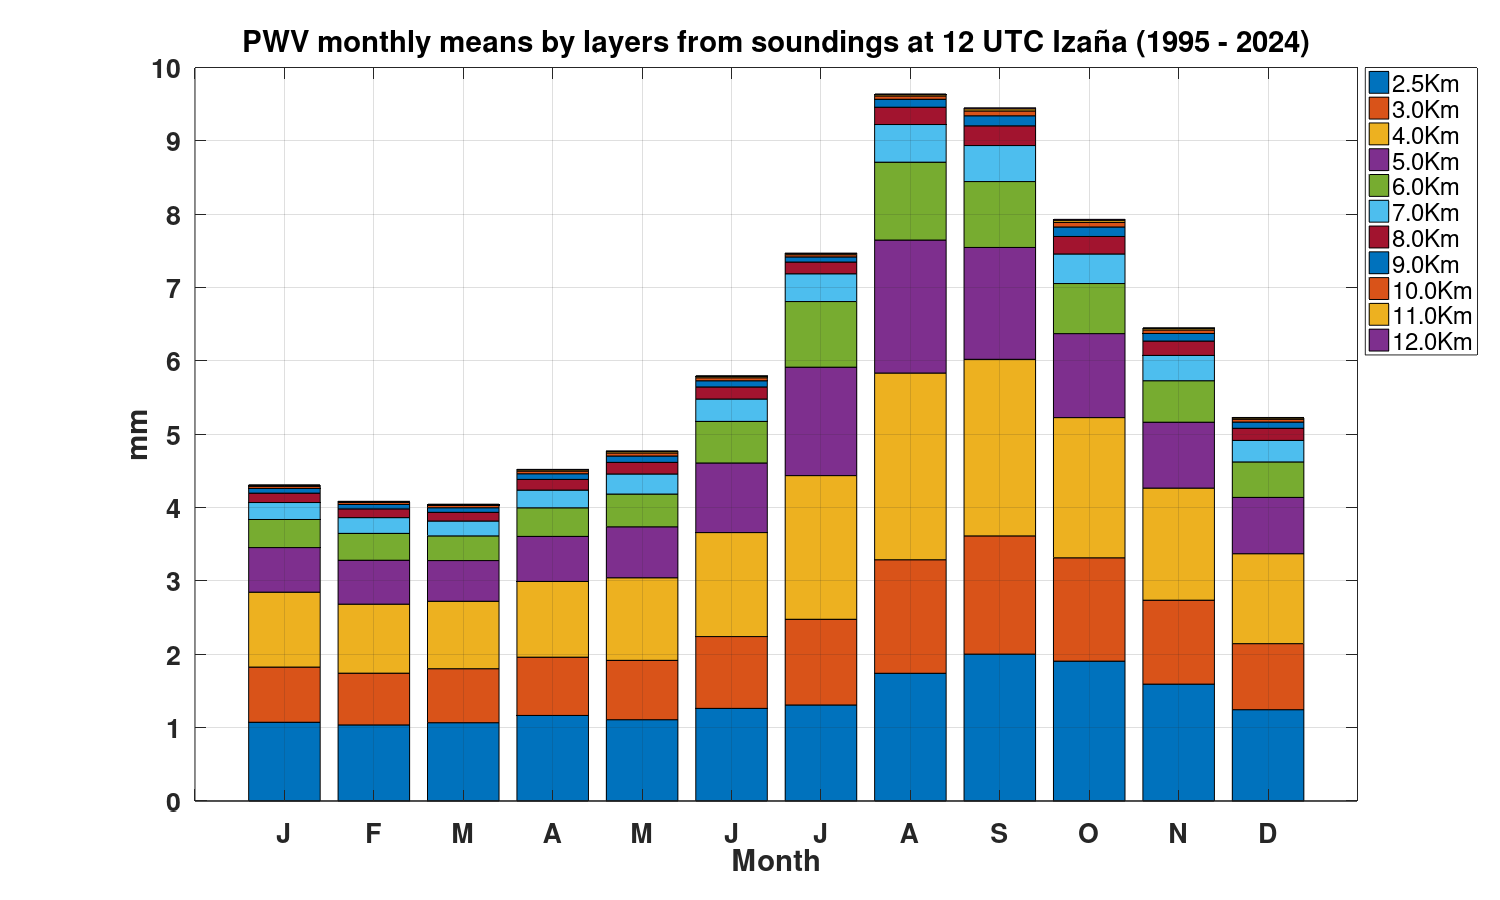
Figure 2. Monthly PWV content by layers from radiosondes in IZO at 12 UTC. 1995-2024. August and September are the months with the highest PWV content and from January to March is when the atmosphere is driest.
From 13 December 2017, the RS92 Vaisala radiosondes have been replaced by RS41 Vaisala radiosondes. The RS41 radiosonde has a higher temporal resolution (1s) compared to the RS92 radiosonde (2s). This results in a greater number of levels in the vertical profiles for pressure, temperature and humidity. However, at high altitudes (~14 km in the stratosphere), we have frequently detected a weak decrease in altitude in the RS41 radiosonde data. It could be due to the combination between an excessively high temporal resolution and longer response times and errors of the different meteorological sensors and GNSS. For these reasons, those records are filtered from the files before they are evaluated.
At Izaña Station level (~2400 m.a.s.l.) we are in the free troposphere. At this altitude, strong inhomogeneities are not expected in the column-integrated magnitudes like PWV obtained from the different Vaisala radiosondes. However, we will analyse the homogeneity of the monthly and annual mean series for the total PWV column and characterize the strength on the possible breakpoints following the methodology described in (Lanzante, 1996).
Figure 3, shows the evolution over time of the annual mean PWV series from radiosondes at IZO at 0UTC and 12UTC. In it, we can see wet periods with annual means above the average of the total period and dry periods with the annual means below. 2005 was an especially wet year and from 2020, we seem to be entering a new wet period.
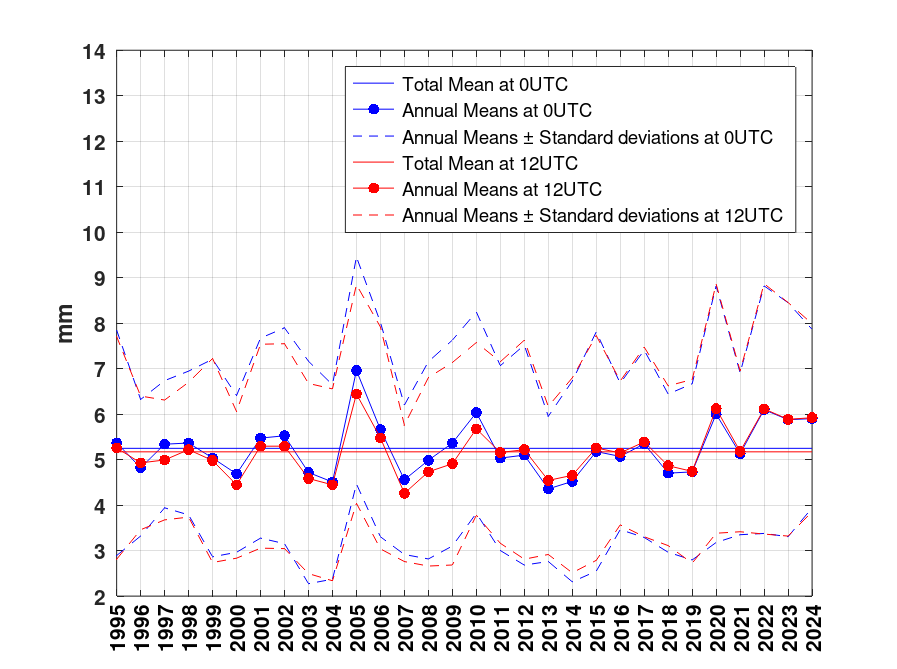
Figure 3. Evolution over time of PWV annual means from radiosondes at IZO at 0UTC and 12UTC.
Global Navigation Satellite System technique
The Global Navigation Satellite System (GNSS) technique consists in determination of PWV in the atmospheric column from the observed delay in radio signals at two different frequencies emitted by a network of Global Positioning System (GPS) and GLONASS satellites received in our GNSS receiver.
The presence of the atmosphere causes a delay in the arrival of radio signals sending from satellite constellation to ground-based GNSS receivers due to atmospheric refraction. This delay, called zenith total delay (ZTD), can be expressed in units of distance (mm). Part of this delay is due to the dry atmosphere (zenith hydrostatic delay, ZHD) and part is due to the water vapour contained in the atmosphere (zenith wet delay, ZWD). Thus: ZTD = ZHD + ZWD. The PWV can be, approximately obtained, as PWV=0.15*ZWD (Romero-Campos et al., 2009).
Currently, we work with eleven GNSS receiver stations at different heights, ten of them in Tenerife and one in La Palma Island (Figures 4 and 5). This GNSS network and data acquisition are managed by the Spanish National Geographic Institute (IGN).
The atmospheric pressure in places where the GNSS antennas are located is a key parameter to obtain the zenith hydrostatic delay. Therefore, it is important to have a barometer located next to the GNSS receiver or as close as possible to it. However, this is not always the case.
For this reason, an important task we do is estimate the pressure in the GNSS sites where measurements of surface pressure are not available. To do this, we interpolate three-dimensionally the temperatures from the meteorological stations network over Tenerife and La Palma Islands considering a linear relationship between temperatures measured at two different levels of altitude and applying the relationship between pressure, temperature and vertical temperature gradient obtained by combining the hydrostatic equation and the law of perfect gases.
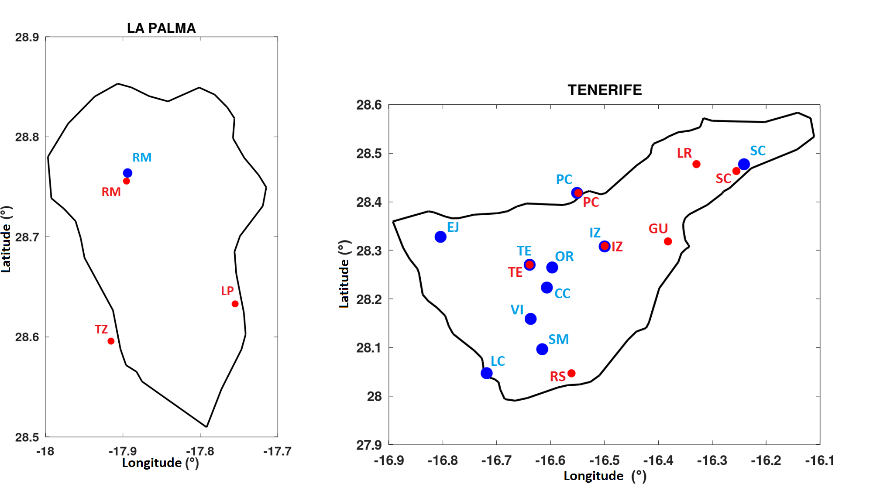
Figure 4. Map of GNSS and Meteorological Stations on Tenerife and La Palma Islands.
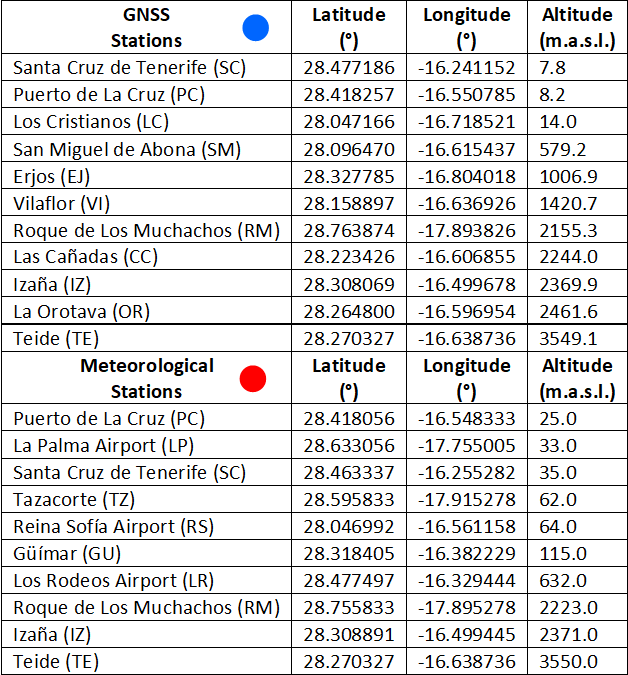
Figure 5. Coordinates of GNSS and Meteorological Stations in Tenerife and La Palma Islands
On Figure 6, we shows the annual mean cycle for GNSS PWV at IZO. 2009-2024.
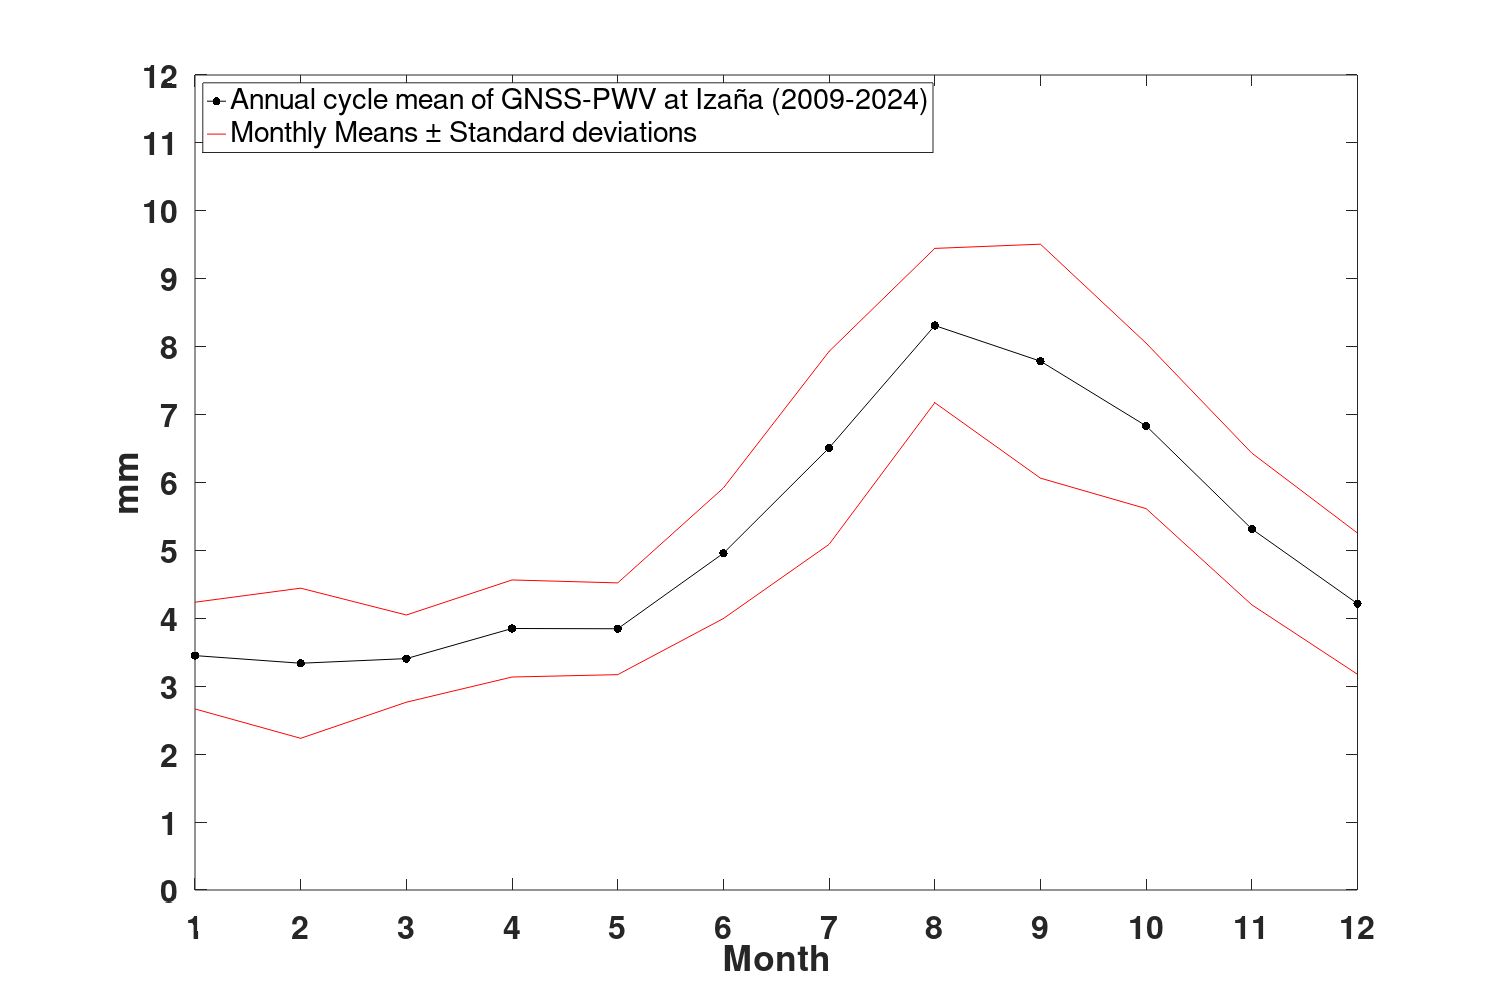
Figure 6. Annual mean cycle for GNSS PWV and its standard deviation at IZO. 2009-2024.
The wettest month in IZO is August.
Microwave Radiometer
In order to support and improve the temporal resolution of temperature and humidity profiles from soundings and to increase the number of days and the number of daily data acquisition intervals, a high-precision microwave radiometer for continuous atmospheric profiling, specially designed for the measurement of water vapour in very dry atmospheres (PWV < 3 mm), was installed at the IZO Measurement Tower at 2400 m.a.s.l. in May 2020 (Figure 7). The acquired model is the RPG-LHATPRO-G5 series of Radiometer Physics Rohde & Schwarz Company which will allow us to obtain tropospheric temperature and humidity vertical profiles with a vertical spatial resolution of 200 m to 400 m, depending on the altitude level, and a temporal resolution of 1 minute. It works with two receivers, one of six narrowband channels centered over 183 GHz water vapour line to obtain humidity and water vapour profiles and, the other one, of seven narrowband channels centered over 60 GHz oxygen absorption line for temperature profiling.
The brightness temperature is related to the blackbody spectral radiation through Planck’s law. Since microwaves are low frequency electromagnetic radiation the relationship between radiation and brightness temperature given by Planck’s law can be approximated, for each working frequency, by a linear relationship consistent with the Rayleigh-Jeans approximation. This linear relationship between radiation and brightness temperature serves as the basis for the calibration process that will transform the voltage corresponding to the received radiation on the several channels into brightness temperatures. From the brightness temperatures, the different products, as PWV, will be obtained by means of an inversion algorithm based on Artificial Neural Networks (ANN).
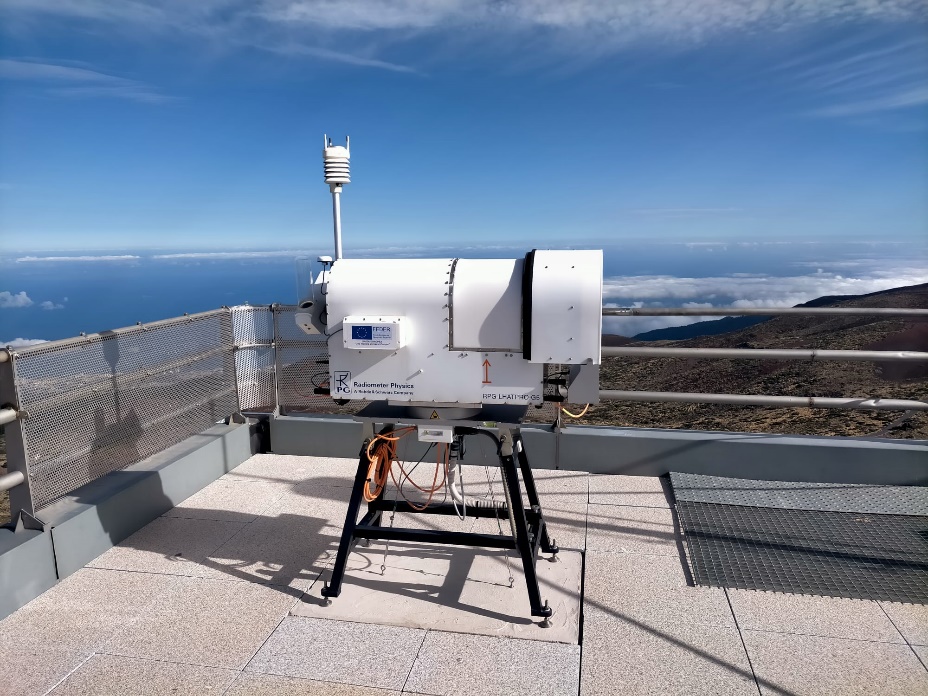
Figure 7. Microwave radiometer RPG-LHATPRO- G5 series installed at IZO at 2400 m.a.s.l.
On 20 January 2021, we requested the incorporation of the microwave radiometer as a measurement instrument into the E-PROFILE Profiling Programme and on 11 March 2021, IZO was included in a list of potential stations of the new E-PROFILE MWR Network still under development and not operational to date. On 24 March 2023, the MWR was officially registered within E-PROFILE and raw data in hourly files is sent automatically and processed through a centralized hub as part of a pilot program. Currently, Met Office and MeteoSwiss are working on L1 products and their dissemination improving the quality checks and setting up a daily monitoring based on observation and simulation for the brightness temperature.
In December 2023, we have performed an intercomparison of the PWV obtained from the different methodologies and techniques described in order to experimentally characterize the detection limit of this variable for each of the techniques, its accuracy and precision, as well as its dependence on other factors (Romero-Campos et al., 2023):
(https://www.aemet.es/documentos/es/conocermas/recursos_en_linea/publicaciones_y_estudios/publicaciones/NT_%2040_%20AEMET/NT_40_AEMET.pdf).
A threshold of 1.7 mm has been established that will determine when IWV measurements made by different techniques can be considered traceable to each other.
It is also established that in studies where we have data gaps in the IWV series of microwave radiometers, the most suitable techniques to fill these gaps would be FTIR during the day, and RS41 radiosondes during the night.
On Figure 8, we show the monthly average series from radiosondes RS41, GNSS, and MWR in IZO at 12UTC. We see how the series are similar with the same qualitative and quantitative behavior. These monthly series have been obtained using months in which at least 60 percent of the data are available. For the moment, we have not detected any significant inhomogeneity or trend in the PWV series, neither during the day nor during the night.
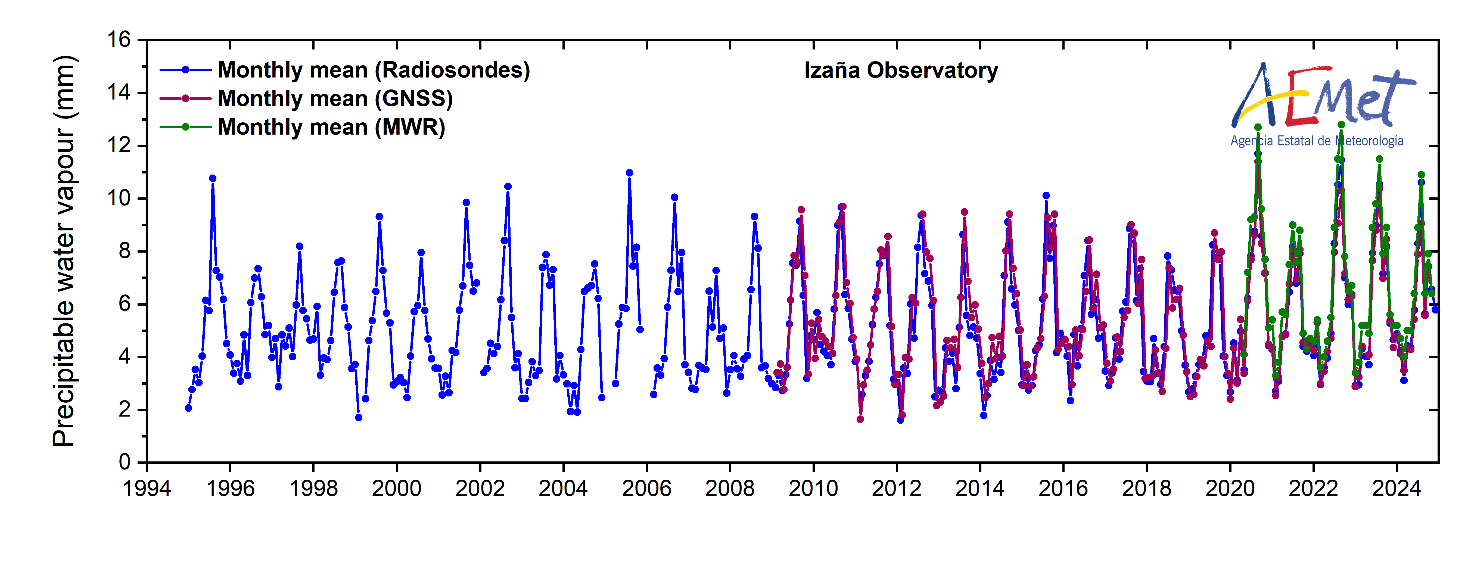
Figure 8. Monthly averages PWV series at IZO at 12UTC. In blue, PWV from radiosondes; in red, PWV from GNSS and in green, PWV from MWR.
References
Romero-Campos P.M., García Cabrera R.D., Almansa Rodríguez A.F., Barreto Velasco Á., García Rodríguez O.E., Ramos López R. Medida del vapor de agua integrado en columna sobre el Observatorio Atmosférico de Izaña mediante radiometría de microondas. Comparación con otras técnicas. Ministerio para la Transición Ecológica y el Reto Demográfico. Agencia Estatal de Meteorología (AEMET). NIPO: 666-23-008-5. 2023.
Romero-Campos P.M., Marrero C., Alonso S., Cuevas E., Afonso S., and Ortiz de Galisteo J.P.: Una Climatología del Agua Precipitable en la Región Subtropical sobre la Isla de Tenerife basada en Datos de Radiosondeos. NTD Nº 6 de AEMET. NIPO: 281-12-007-5. Centro de Investigación Atmosférica de Izaña. Agencia Estatal de Meteorología (España), 2012.
Romero-Campos P.M., Cuevas Agulló E., Ramos López R., Valdés Pérez de Vargas M., Schneider M. Programa de vapor de agua en columna del Centro de Investigación Atmosférica de Izaña: Análisis e intercomparación de diferentes técnicas de medida. NTD N° 1 del CIAI. Ministerio de Medio Ambiente, y Medio Rural y Marino. Agencia Estatal de Meteorología (AEMET). NIPO: 784-09-009-9. 2009.
Lanzante, J., Resistant, Robust and Non-Parametric Techniques for the Analysis of Climate Data: Theory and Examples, including Applications to Historical Radiosonde Station Data. International Journal of Climatology, Vol. 16, 1197-1226, CCC 0899-8418/96111197-30, by the Royal Meteorological Society, 1996.
Publications
Almansa, A.F.; Cuevas, E.; Barreto, Á.; Torres, B.; García, O.E.; Delia García, R.; Velasco-Merino, C.; Cachorro, V.E.; Berjón, A.; Mallorquín, M.; López, C.; Ramos, R.; Guirado-Fuentes, C.; Negrillo, R.; de Frutos, Á.M: Column Integrated Water Vapor and Aerosol Load Characterization with the New ZEN-R52 Radiometer, Remote Sens., 12, 1424, 2020.
Barreto, A., Cuevas, E., Damiri, B., Romero, P. M., and Almansa, F.: Column water vapor determination in night period with a lunar photometer prototype, Atmos. Meas. Tech., 6, 2159-2167, doi: 10.5194/amt-6-2159-2013, 2013.
Barreto, A., Cuevas, E., Granados-Muñoz, M. J., Alados-Arboledas, L., Romero, P. M., Gröbner, J., Kouremeti, N., Almansa, A. F., Stone, T., Sorokin, M., Holben, B., Canini, M., and Yela, M.: The new sun-sky-lunar Cimel CE318-T multiband photometer – a comprehensive performance evaluation , Atmos. Meas. Tech., 9, 631-654, 2016 doi: 10.5194/amt-9-631-2016.
García, O. E., Schneider, M., Sepúlveda, E., Hase, F., Blumenstock, T., Cuevas, E., Ramos, R., Gross, J., Barthlott, S., Röhling, A. N., Sanromá, E., González, Y., Gómez-Peláez, Á. J., Navarro-Comas, M., Puentedura, O., Yela, M., Redondas, A., Carreño, V., León-Luis, S. F., Reyes, E., García, R. D., Rivas, P. P., Romero-Campos, P. M., Torres, C., Prats, N., Hernández, M., and López, C.: Twenty years of ground-based NDACC FTIR spectrometry at Izaña Observatory – overview and long-term comparison to other techniques, Atmos. Chem. Phys., 21, 15519–15554, https://doi.org/10.5194/acp-21-15519-2021, 2021.
García, R.D.; Cuevas, E.; Cachorro, V.E.; García, O.E.; Barreto, Á.; Almansa, A.F.; Romero-Campos, P.M.; Ramos, R.; Pó, M.; Hoogendijk, K.; Gross, J. Water Vapor Retrievals from Spectral Direct Irradiance Measured with an EKO MS-711 Spectroradiometer—Intercomparison with Other Techniques. Remote Sens., 13, 350. https://doi.org/10.3390/rs13030350, 2021.
Romero-Campos P.M., García Cabrera R.D., Almansa Rodríguez A.F., Barreto Velasco Á., García Rodríguez O.E., Ramos López R. Medida del vapor de agua integrado en columna sobre el Observatorio Atmosférico de Izaña mediante radiometría de microondas. Comparación con otras técnicas. Ministerio para la Transición Ecológica y el Reto Demográfico. Agencia Estatal de Meteorología (AEMET). NIPO: 666-23-008-5. 2023.
Romero-Campos P.M., Marrero C., Alonso S., Cuevas E., Afonso S., and Ortiz de Galisteo J.P.: Una Climatología del Agua Precipitable en la Región Subtropical sobre la Isla de Tenerife basada en Datos de Radiosondeos. NTD Nº 6 de AEMET. NIPO: 281-12-007-5. Centro de Investigación Atmosférica de Izaña. Agencia Estatal de Meteorología (España), 2012.
Romero Campos, P. M., Cuevas Agulló, E., Ramos López, R., Valdés Pérez de Vargas, M., Schneider M., Programa de vapor de agua en columna del Centro de Investigación Atmosférica de Izaña: Análisis e intercomparación de diferentes técnicas de medidas. Nota Técnica Digital Nº 1, Ministerio de Medio Ambiente, y Medio Rural y Marino, Agencia Estatal de Meteorología, Madrid. NIPO: 784-09-009-9, 2009.
Schneider, M., Romero, P. M., Hase, F., Blumenstock, T., Cuevas, E., and Ramos, R.: Continuous quality assessment of atmospheric water vapour measurement techniques: FTIR, Cimel, MFRSR, GPS, and Väisala RS92, Atmos. Meas. Tech., 3, 323–338, https://doi.org/10.5194/amt-3-323-2010, 2010.
Staff
Pedro Miguel Romero Campos (Head of programme)
Dra. África Barreto Velasco (Research Scientist)
Dra. Rosa Delia García Cabrera (Research Scientist)
Dr. Antonio Fernando Almansa Rodríguez (Research Scientist)
Dra. Omaira Elena García Rodríguez (Research Scientist)
Ramón Ramos López (Head of Infrastructure)