The Izaña Observatory confirms that the growth rate of the main greenhouse gases continues to increase. The atmospheric CO2 mole fraction reaches a new historical record.
![]()
Clic here for spanish version
The Izaña Observatory (IZO), managed by the State Meteorological Agency (AEMET), started its greenhouse gas monitoring program in 1984. Since then, the measurements made show how the atmospheric mole fraction of carbon dioxide (CO2), the main greenhouse gas, has experienced a progressive increase as shown in Figure 1. In 2024, the average monthly mole fraction in May was 427.45 ppm (parts per million), an increase of 3.59 ppm with respect to the previous maximum, 423.86 ppm recorded in May 2023. Similarly, the Mauna Loa Observatory (MLO, Hawaii, NOAA), whose record series began in 1958 and acts as a global reference, has reported that the average monthly mole fraction for May was 426.90 ppm, an increase of 2.9 ppm over the value of 424 ppm recorded the previous year [1]. Although, these records are provisional, the final ones will not differ significantly.
It is not a coincidence that the two observatories, separated by more than 13,000 km, record similar concentrations. This is because their observations are representative of the background atmospheric composition, since both are high mountain stations and located at similar latitudes and their measurements are not directly affected by anthropogenic pollution sources. All this allows them to accurately measure long-term changes in global atmospheric composition. To give a clearer context of the negative impact of human activity on the atmosphere and, therefore, on climate change, it is only necessary to compare the current CO2 records with the 280 ppm at the beginning of the industrial revolution [2].
Figure 1 shows the monthly mean CO2 mole fraction recorded at IZO since 1984, where it is possible to identify, on the one hand, an annual seasonal cycle associated with CO2 exchange between the atmosphere and the biosphere and, on the other hand, an increasing trend associated with anthropogenic emissions. The seasonal cycle peaks in spring and then decreases due to increased CO2 absorption caused by increased photosynthetic activity of vegetation. The arrival of autumn marks the beginning of the loss of vegetation cover, producing the opposite effect and leading to a progressive release of CO2 into the atmosphere (see enlarged graph in Figure 1).

Figure 1. Monthly mean (red) and trend line (blue) of atmospheric CO2 mole fraction at Izaña Observatory. The enlarged image shows in detail the CO2 mole fraction in the period 2016-2024.
The trend line, obtained by subtracting the average annual cycle from the records, represents the increase in CO2 caused by human emissions, mostly from the burning of fossil fuels.
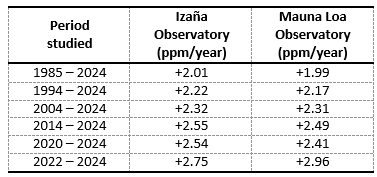
A significant and worrying fact from these monthly records is obtained when comparing the increase in CO2 mole fraction between two annual maxima, as shown in Table 1. Although, a priori, one might think that this difference is constant, the records suggest that this average increase in CO2 (ppm/year) is accelerating. This is demonstrated by analysing small time intervals referring to the most recent years. This acceleration is also observed in the MLO records, confirming that this is a global-scale phenomenon.
Table 1. Difference between monthly mean CO2 mole fraction maxima at IZO and MLO for different year intervals.
Methane (CH4), the second most important greenhouse gas, has also been measured in IZO since 1984. Although its presence is several orders of magnitude lower than CO2, it has a large impact due to its high warming potential, 28 times higher than that of CO2 and therefore much more efficient in heating the atmosphere [2]. Monitoring changes in its concentration is therefore crucial to understanding global warming and its evolution. Figure 2 shows the trend line and monthly mean CH4 mole fraction under background conditions at IZO.
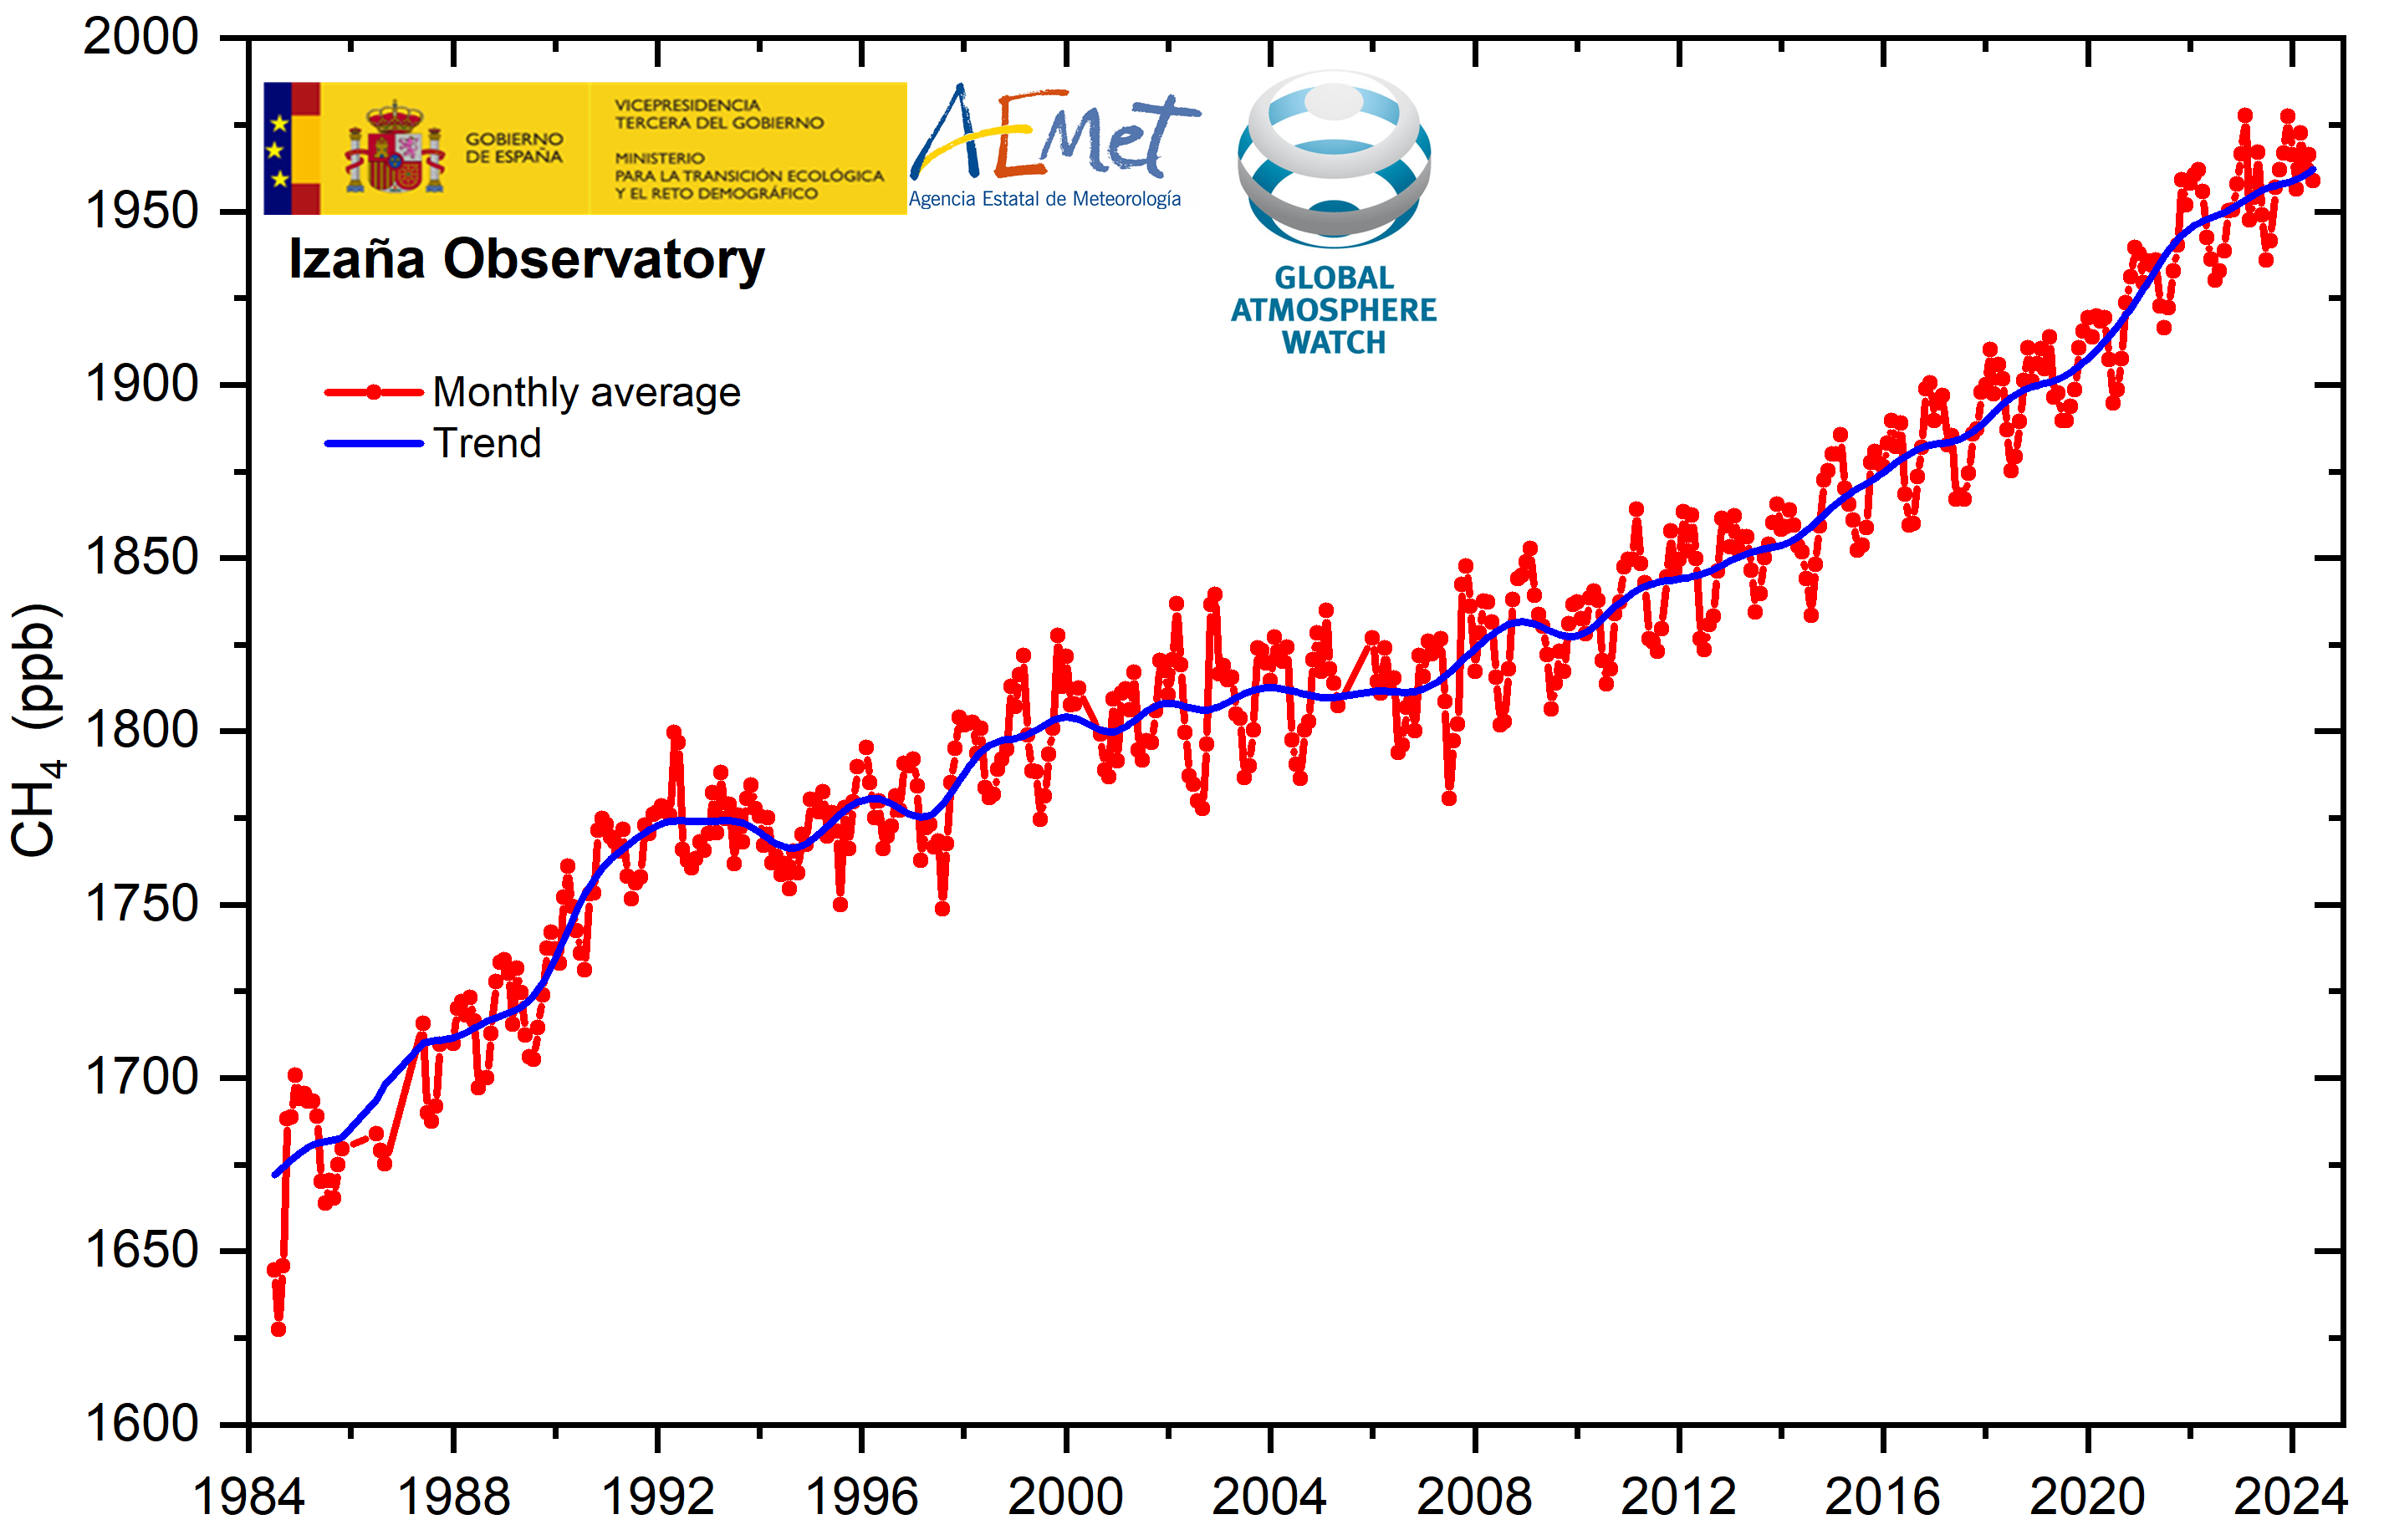
Figure 2. Monthly mean (red) and trend (blue) of the CH4 mole fraction at Izaña Observatory in the period 1984-2024.
Like CO2, measurements at IZO suggest that the presence of this gas in the atmosphere is increasing. Possible sources are currently being studied, both natural, such as the thawing of terrestrial permafrost, which has so far acted as a large reservoir of CH4, thus releasing large amounts of this gas, and anthropogenic sources associated with the remarkable growth of agriculture and livestock, as well as increased oil and natural gas production [3-5].
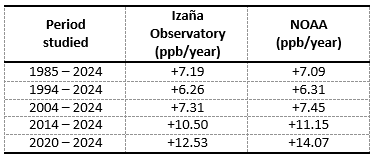
The measurements made at IZO show that the presence of these gases is accelerating as a function of the period analysed, as shown in Table 2, which also includes the same analysis based on the global average obtained from all NOAA flask sampling stations [6].
Table 2. Interannual variations of CH4 mole fraction at IZO and globally from all NOAA point sampling stations for different periods since 1985. The interannual variations are calculated as the difference between the mean January trend values for the selected years.
In conclusion, the records of both IZO and the other observatories show that the CO2 and CH4 mole fractions continue to increase and show no sign of slowing down, confirming that the impact of the regulations implemented to mitigate greenhouse gas emissions does not have an immediate effect and must be sustained over time.
IZO and MLO are part of the World Meteorological Organization – Global Atmosphere Watch Programme (WMO-GAW). In addition, IZO has joined in 2023 the Integrated Carbon Observing System (ICOS) infrastructure of the European Commission for the observation and monitoring of greenhouse gases. The national node, ICOS-Spain, is formed by the atmospheric stations of El Arenosillo (Instituto Nacional de Técnica Aeroespacial), the oceanic stations CAnoA-SOOP (Universidad de Las Palmas de Gran Canaria) and ESTOC (Plataforma Oceánica de Canarias) and the associated ecosystem station of Majadas de Tiétar (Centro de Estudios Ambientales del Mediterráneo). The atmospheric segment will be extended in 2024 with the incorporation of CIBA (Universidad of Valladolid).
References:
[1] https://gml.noaa.gov/ccgg/trends/
[2] IPCC, 2022: Climate Change 2022: Impacts, Adaptation, and Vulnerability. Contribution of Working Group II to the Sixth Assessment Report of the Intergovernmental Panel on Climate Change [H.-O. Pörtner, D.C. Roberts, M. Tignor, E.S. Poloczanska, K. Mintenbeck, A. Alegría, M. Craig, S. Langsdorf, S. Löschke, V. Möller, A. Okem, B. Rama (eds.)]. Cambridge University Press. Cambridge University Press, Cambridge, UK and New York, NY, USA, 3056 pp., doi:10.1017/9781009325844.
[3] Annual increase in whole-atmosphere mean methane concentration for 2021 marks the largest since 2011, https://www.eurekalert.org/news-releases/946874
[4] Saunois M., Jackson R.B., Bousquet P., Poulter B., Canadell J.G. (2016), The growing role of methane in anthropogenic climate change, Environ Res Lett, 11, 120207.
[5] Froitzheim N, Majka J, Zastrozhnov D. Methane release from carbonate rock formations in the Siberian permafrost area during and after the 2020 heat wave. Proc Natl Acad Sci U S A. 2021 Aug 10;118(32):e2107632118. doi: 10.1073/pnas.2107632118. Erratum in: Proc Natl Acad Sci U S A. 2021 Oct 12;118(41):e2115789118. doi: 10.1073/pnas.2115789118. PMID: 34341110; PMCID: PMC8364203.
[6] https://gml.noaa.gov/ccgg/trends_ch4/