Annual increase of the atmospheric Greenhouse Gases at the Izaña Atmospheric Observatory during 2014
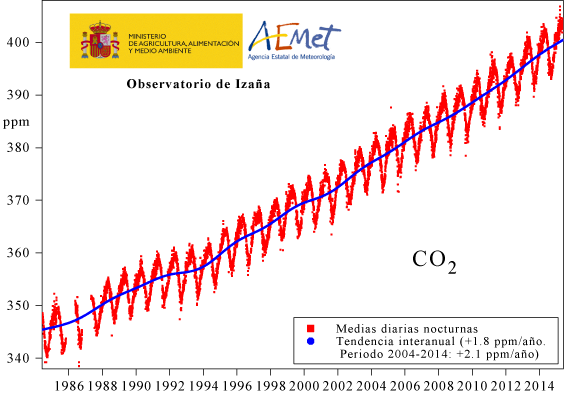
The plot above these lines shows the night-time means (during the night-times period there are free troposphere conditions at Izaña) for the atmospheric carbon dioxide (CO2) mole fraction measured at the Izaña Atmospheric Observatory (for the period: June 1984 till May 2015). The graph shows a seasonal cycle, which is due to the CO2 exchange with the biosphere, is superposed to the interannual growth, which is due to the anthropogenic emissions.
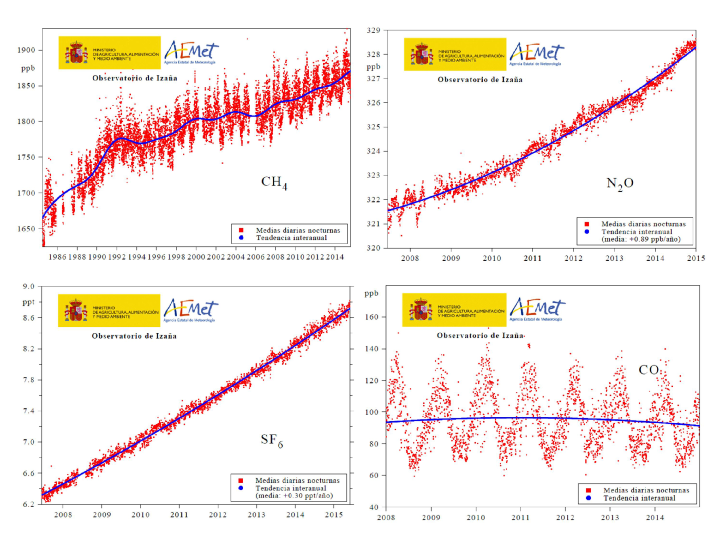
The graph panel bellow these lines shows the night-time means measured at Izaña for atmospheric methane (CH4), nitrous oxide (N2O), sulphur hexafluoride (SF6) and carbon monoxide (CO).
These five atmospheric gases are well mixed greenhouse gases (also called long-lived) except carbon monoxide, which is an indirect greenhouse gas because it affects the atmospheric methane concentration (the destruction rate of atmospheric CH4 slightly decreases when CO concentration increases). The ordering of these gases according to their impact in the increase of the greenhouse effect above the preindustrial level of the year 1750 is: 1st) CO2, 2nd) CH4 and 3rd) N2O.
These five gases can be classified in two types according to their atmospheric lifetimes: those with relatively short lifetimes (CO –a few months- and CH4 –around 9 years-) and those with a very long lifetime (CO2 –hundred of years-, N2O –around 120 years-, and SF6 –around 3200 years-). There is an important difference between both gas types: the formers can achieve a equilibrium between emission and destruction (in such case, the gas concentration would remain constant in the atmosphere); whereas for the latters, their concentrations always continue growing while there are emissions. This explains why the measured concentrations at Izaña (see the graphs) always grow (long-term trend, without taking into account the annual cycle) for CO2, N2O and SF6; whereas the CH4 concentration has had periods with no growth, and CO is even decreasing.
The impact of the present emissions of the different gases in a given future time instant is quantified using the Global Temperature change Potential (GTP), which is based on the change of the Global Mean Surface Temperature (GMST) produced by these (present) emissions for the different time horizons using as reference that produced by CO2. The GTP for a 10-year time horizon due to the CH4 present emissions is almost equal to that produced by the CO2 present emissions; however it is a bit more than one half for a 20-year time horizon, and almost negligible for a 100-year time horizon (because the CH4 emitted 100 years before will have been almost completely destroyed). On the other hand, the GTP produced by the N2O present emissions remains constant for those time horizons, because its lifetime is long and similar to that for CO2 (to see more details about GTP see: IPCC, Fifth AR, Technical Summary, 2013).
The atmospheric background mean values measured at the Izaña Atmospheric Observatory during 2014 were: 398.6 ppm for CO2, 1857 ppb for CH4, 327.7 ppb for N2O, 8.42 ppt for SF6 and 92.3 ppb for CO. The increment measured at Izaña from 2013 to 2014 (difference of annual averages) was 2.0 ppm for CO2, 5 ppb for CH4, 1.4 ppb for N2O, 0.36 ppt for SF6, and -0.7 ppb for CO. The CO2 annual mean growth rate measured during the last decade has been 2.1 ppm/year. The N2O annual mean growth rate measured at Izaña since its measurements started has been 0.89 ppb/year, whereas that for SF6 has been 0.30 ppt/year.
Downloading of Izaña graphs (high resolution pdf’s): 1) click here to download the CO2 plot; 2) click here to download the panel that includes 4 plots (shown in the present news); 3) click here to download the CH4 plot; 4) click here to download the N2O plot; 5) click here to download the SF6 plot; 6) click here to download the CO plot.