The state of greenhouse gases in the atmosphere based on global observations through 2013
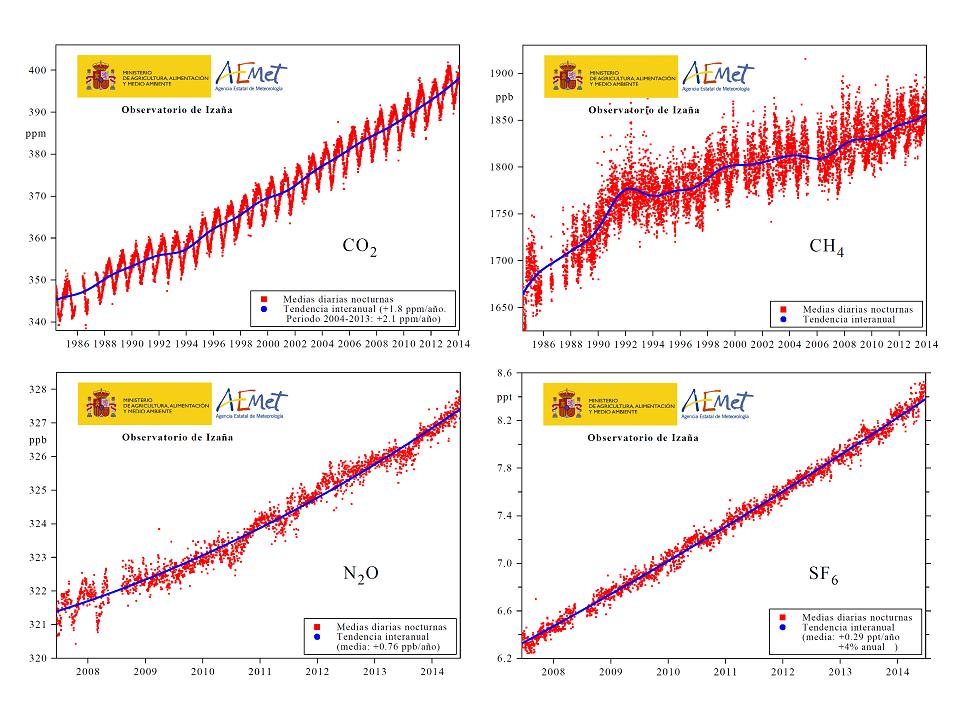
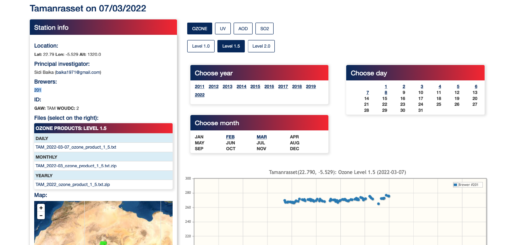
On September 9th, 2014, the World Meteorological Organization (WMO) published its tenth annual atmospheric greenhouse gas bulletin (click here to download the bulletin in pdf format), based on global observations through 2013. Most of these measurements were carried out at stations of the Global Atmosphere Watch (GAW) programme of the WMO. In particular, Izaña Atmospheric Research Center (CIAI) of the Meteorological State Agency of Spain (AEMET) contributes with highly precise and accurate measurements carried out at the Izaña global GAW station (Tenerife), showed in the panel with four plots that heads this article (click here to download a pdf with that 4-plot panel; click here to download a pdf with the CO2 plot; click here to download a pdf with the CH4 plot; click here to download a pdf with the N2O plot; click here to download a pdf with the SF6 plot).
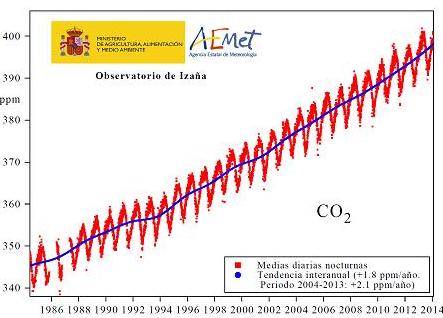
Globally averaged mole fractions of CO2, CH4 and N2O reached new highs in 2013: with CO2 at 396.0 ppm (parts per million –molecules of CO2 per million of dry air molecules-), CH4 at 1824 ppb (parts per billion) and N2O at 325.9 ppb. These values represent, respectively, 142%, 253% and 121% of pre-industrial levels (before 1750). The background atmospheric annual mean mole fractions measured at Izaña Observatory during the year 2013 were: 396.6 ppm for CO2, 1852 ppb for CH4, and 326.2 ppb for N2O (note that the mole fractions measured at Izaña are greater than the background world means, due to the fact that most of the anthropogenic sources of greenhouse gases are in the Northern Hemisphere. In the Southern Hemisphere, mole fractions are a bit smaller than in the Northern one due to the time it takes to the atmosphere to transport such gases from one Hemisphere to the other one).
The global atmospheric CO2 increase from 2012 to 2013 (difference of annual means) was 2.9 ppm, whereas for CH4 was 6 ppb and for N2O was 0.8 ppb (almost identical to those measured at Izaña). This CO2 year to year increase is the largest of the last 30 years (the mean year to year increase in the last decade has been 2.1 ppm/year). This excess above the 2.1 ppm/year value, is not mainly due to an increase in the CO2 emissions from fossil fuel combustion (these emissions increase recently at a rate 2% per year), but it is due to a transient net CO2 emission of the biosphere (the exact cause –respiration greater than photosynthesis, and/or biomass burning- is being investigated).
The radiative forcing (above the natural pre-industrial level) due to long-lived greenhouse gases has increased 34% above the level of the year 1990 (CO2 accounting for 80% of this increase).
A part of the emitted anthropogenic CO2 is absorbed by the Oceans, where it remains dissolved and increases the water acidity. The annual WMO greenhouse gas bulletin includes by first time also some time series of measurements of CO2 dissolved in ocean water and the acidity of this water. In particular, the bulletin includes the time series of the measurements of this type carried out at the ESTOC station (European Station for Time Series in the Ocean near the Canary Islands, run by Canary Islands Institute of Marine Science), that started in 1994. Therefore, in Canary Islands there are two stations (one atmospheric and the other one oceanic) with long time series of CO2 measurements, very relevant worldwide.