Annual increments of CO2, CH4, N20 and SF6 measured at Izaña (extended version)
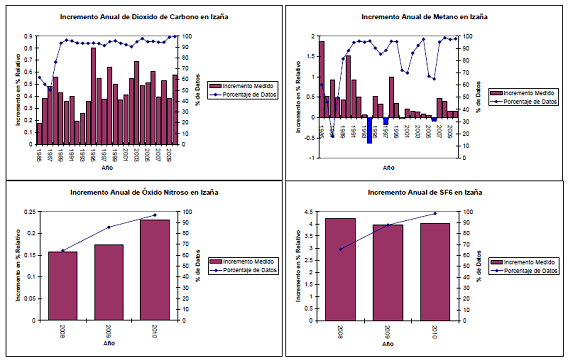
The panel with the graphics (click it to see the panel at a larger size) shows the annual increments (in relative percentage, click here to see the graphics of absolute increments) for the greenhouse gases CO2, CH4, N2O, and SF6 measured at Izaña Atmospheric Observatory. In detail, the annual increment for a given year has been obtained computing the difference between the mean of such year and the mean of the previous year, therefore, there is not increment associated to the first year of each measurement series.
The time series with daily data for these gases measured at Izaña can be seen in the following Izaña news: CO2 (news dated on April 5, 2011), CH4 (news dated on March 29, 2011), N2O (news dated on March 21, 2011), and SF6 (news dated on April 5, 2011), additionally to comments about each atmospheric component and series.
The few time intervals in the series with data gaps, have been filled using an estimation obtained from the series themselves: interannual trend (blue line of the corresponding time series) plus a constant in time annual cycle (no plotted in the graphics with the series), both computed applying a Fourier analysis and keeping only the appropriate harmonics (click here to see specialized information about this topic). Due to the fact that this method is not perfect, the first computed annual increment for each series (for example, 1985 for CO2 and CH4) has a very high uncertainty (error), because all these gas measurements were initiated in middle year (in June for CO2, N2O, and SF6; and July for CH4). Additionally, such method can introduce a high uncertainty where the gaps are large. Therefore, the graphics also show the percentage of available measured data used to compute the annual increments, in detail, for each increment, the mean percentage of available data in the two years used to compute such increment is plotted.