Atmospheric CO2 and CH4 concentrations measured at Izaña Observatory continue their upward trend.
Click here for the Spanish version

As happens every year at the end of April and beginning of May the CO2 series of the Izaña Observatory (IZO, AEMET) has registered a new historical record as shown in Figure 1. In April 2022, the monthly average concentration of CO2 reached 421.95 ppm (parts per million), which represents an increase of 2.28 ppm from the previous maximum, 419.67 ppm, recorded in 2021. Both values correspond to atmospheric background conditions.
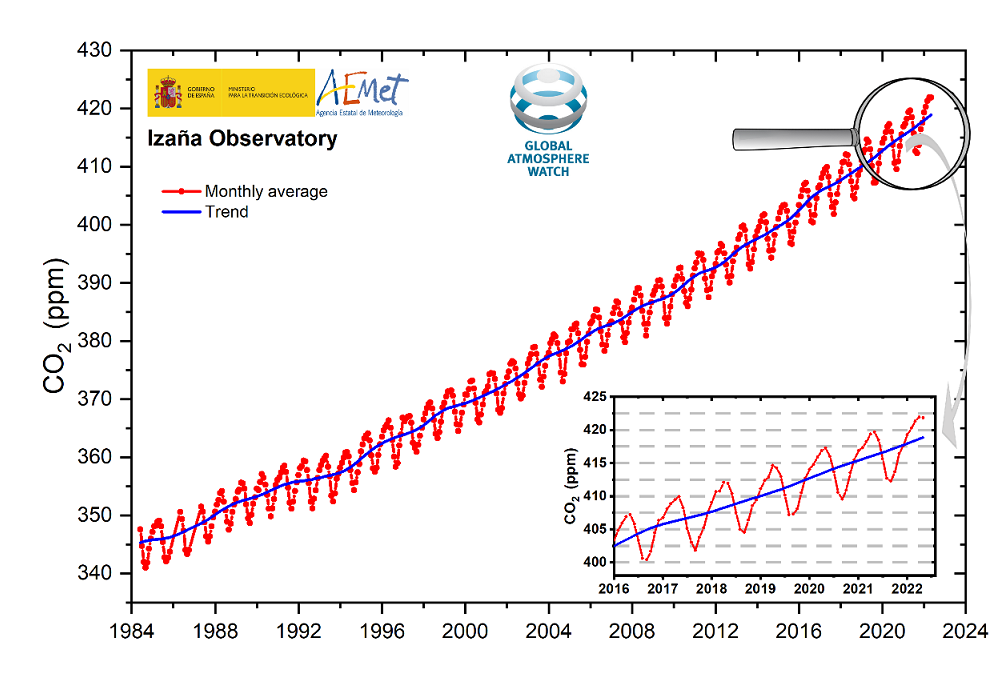
Figure 1. Monthly averages (red points) and trend (blue line) of the CO2 concentration. The zoomed graphic shows the concentrations in the period 2016-2022.
In Figure 1, the trend line represents the increase of background CO2 caused by the anthropogenic emissions, while the monthly mean concentrations show a seasonal variation due to the CO2 exchange between atmosphere and biosphere. Mauna Loa Observatory (MLO, Hawaii, NOAA) also observes a similar CO2 behaviour, reporting its new maximum monthly mean of 420.99 ppm in May 2022 [1]. These data are still provisional, but the final values will not differ greatly. Table 1 shows a summary of the monthly maximum and annual average of the CO2 concentration at IZO and MLO in recent years. Despite the fact that both observatories are 13,200 km apart, both have reported similar CO2 concentrations demonstrating that their measurements are representative of changes in the global atmosphere.
In addition, IZO runs a complex programme for atmospheric gaseous composition monitoring and research based on Fourier transform infrared (FTIR) spectrometry. FTIR spectrometers measure solar absorption spectra, thus recording the absorption footprint of gases present throughout the atmospheric column, unlike the in-situ analysers that record concentrations at surface level. Although both programmes are based on different measurement techniques, their observations can be directly compared at background observatories as IZO. As seen in Table 1, the averaged FTIR values follow the same increasing trend as those reported by the in-situ data, which further confirm that the atmospheric CO2 concentration continues to increase. Although, FTIR measurements are intercompared with air-core soundings and WMO scale are applied, the records still show a certain spectroscopy bias [2].
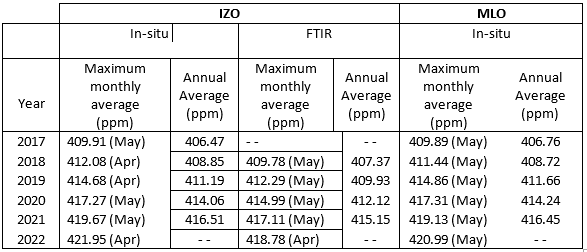
Table 1.Maximum monthly and annual averages of the CO2 concentration (ppm) at IZO and MLO.
Methane (CH4) is the second most important greenhouse gas, after CO2, and is also monitored in the long term by the IZO Greenhouse Gases Programme. This gas, albeit it has a concentration in the atmosphere much lower than CO2, has a warming potential 28 times higher than CO2 [3]. Therefore, monitoring its atmospheric concentrations is essential to understand global warming, as well as to verify the success of the measures adopted to reduce its emission to the atmosphere.
Figure 2 shows the trend line and the monthly averages of CH4 concentration under atmospheric background conditions. Due to CH4 is more chemically active than CO2, whereby it is more sensitive to the variability of its sources and sinks. The measurements made at IZO show that, after an initial period of growth, the CH4 concentration stabilised during the first half of the 2000s and has continued increasing since then. However, this trend has accelerated in the last years as it has been observed both at surface level (see zoomed graphic in Figure 2) and from space-based platforms, thus affecting the entire atmospheric column [4]. The sources that are contributing to this recent acceleration are under study, although different natural and anthropogenic factors are being considered. On the one hand, global warming is responsible for the thawing of the Earth’s permafrost, which has been a large reservoir of CH4 all this time, thereby releasing large amounts of CH4 to the atmosphere. On the other hand, the strong growth of the agriculture and livestock, as well as oil and natural gas production have seen increases in emissions in the last decade [5]. Moreover, the precipitation in the tropics contributes to the inter-annual variations of emissions from wetland areas, where decomposing material is present, and the chemical destruction of this gas in the atmosphere also affects to the final concentration measured [4-6].
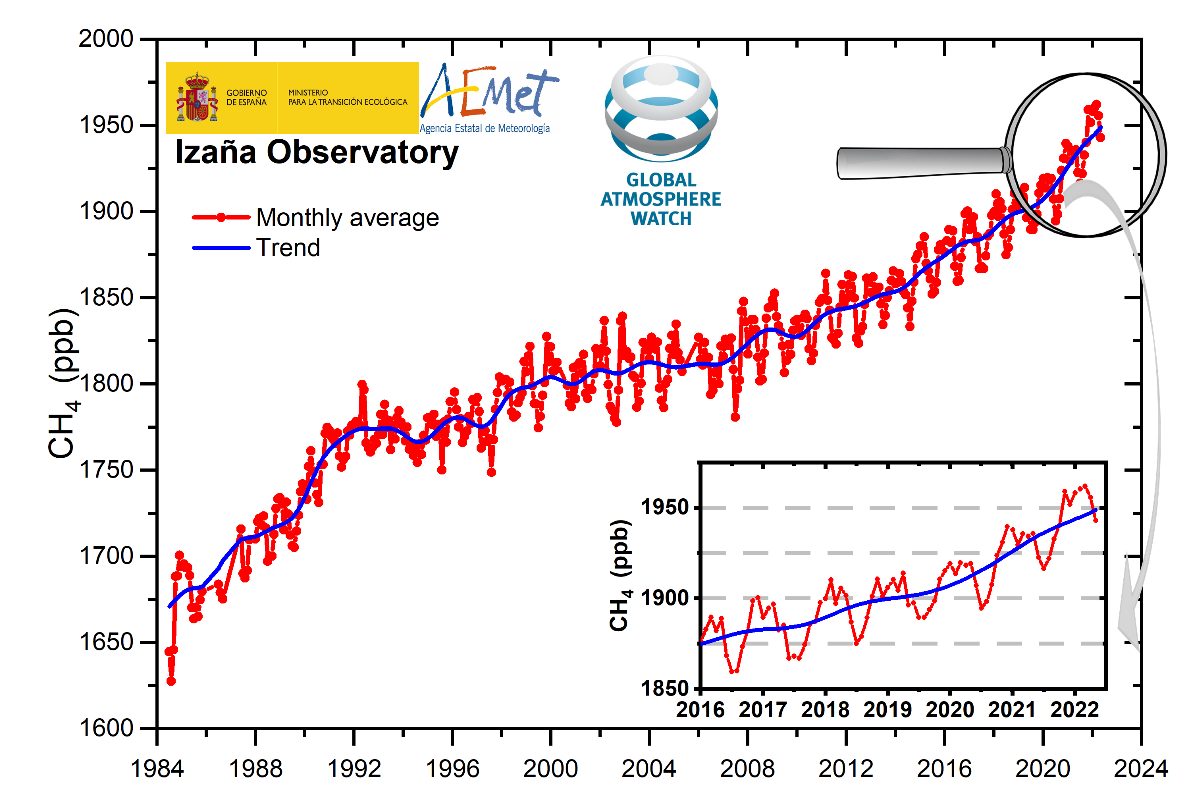
Figure 2. Monthly averages (red points) and trend (blue line) of the CH4 concentration. The zoomed graphic shows the concentrations in the period 2016-2022.
Table 2 contains a summary of interannual variations of CH4 concentration at IZO and a global level, reported by NOAA through its globally distributed network of air sampling site [7, 8]. The global records confirm that there is a clear acceleration in the increase of atmospheric CH4 concentrations, being the growth rate of the last two years almost three times higher than that calculated for the whole period (1985-2022). IZO reported a similar interannual increase, demonstrating that its measurements are well representative of the growth rate of CH4 concentrations in the global atmosphere.
It is important to highlight that the current CO2 and CH4 atmospheric concentrations have been measured after a period of reduced emissions due to the severe restrictions caused by the Covid-19 pandemic, mainly in 2020 but also in 2021 and, in a framework where the European Union is at the forefront of the global fight against the climate change, achieving a reduction of its CO2 emissions in 2019 by 25% compared to those emitted in 1990 according to data provided by Emissions Database for Global Atmospheric Research (EDGAR) [9]. Nevertheless, the current measurements show that the atmospheric CO2 and CH4 concentrations continue to increase with a high growth rate, demonstrating that the impact of regulations implemented to mitigate greenhouse gas emissions do not have an immediate effect and must be maintained over time.
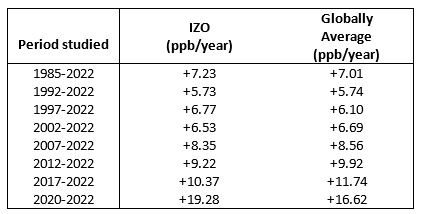
Table 2. Interannual variations of the CH4 concentration (ppb) at IZO and global level for different period studied since 1985. The Interannual variations is calculated as the differences between the CH4 concentrations (ppb) reached on 1 January of the studied periods from the trend values.
IZO and MLO are part of the World Meteorological Organization – Global Atmosphere Watch (WMO-GAW) programme. IZO is also part of Total Carbon Column Observing Network (TCCON), and is currently being incorporated into the European Integrated Carbon Observation System (ICOS) infrastructure for the observation and surveillance of greenhouse gases by the European Commission.
References:
[1] https://gml.noaa.gov/ccgg/trends/
[2] Dohe, S., Hase, F., Sepúlveda, E., Gómez-Peláez, A., Schneider, M., Blumenstock, T., and García, O., CO2 total column amounts at TCCON sites Izaña (28.3 N, 16.5 W) and Karlsruhe (49.1 N, 8.5 E) AIP Conference Proceedings 1531, 304 (2013), https://doi.org/10.1063/1.4804767.
[3] IPCC, 2022: Climate Change 2022: Impacts, Adaptation, and Vulnerability. Contribution of Working Group II to the Sixth Assessment Report of the Intergovernmental Panel on Climate Change [H.-O. Pörtner, D.C. Roberts, M. Tignor, E.S. Poloczanska, K. Mintenbeck, A. Alegría, M. Craig, S. Langsdorf, S. Löschke, V. Möller, A. Okem, B. Rama (eds.)]. Cambridge University Press. In Press.
[4] Annual increase in whole-atmosphere mean methane concentration for 2021 marks the largest since 2011, https://www.eurekalert.org/news-releases/946874
[5] Saunois M., Jackson R.B., Bousquet P., Poulter B., Canadell J.G. (2016), The growing role of methane in anthropogenic climate change, Environ Res Lett, 11, 120207.
[6] Froitzheim, N., Majka J., and Zastrozhnov, D. (2021), Methane release from carbonate rock formations in the Siberian permafrost area during and after the 2020 heat wave August 2,118(32)e2107632118, https://doi.org/10.1073/pnas.2107632118
[7] Dlugokencky, E. J., L. P. Steele, P. M. Lang, and K. A. Masarie (1994), The growth rate and distribution of atmospheric methane, J. Geophys. Res., 99, 17,021– 17,043, doi:10.1029/94JD01245.
[8] https://gml.noaa.gov/ccgg/trends_ch4/