Installation of the CraNOx II analyser for the measurement of nitrogen oxides (NOx) in background conditions at the Izaña Atmospheric Observatory-
Knowledge of the concentration of nitrogen oxides (NOx) in the atmosphere is important because of the role that these compounds play in the chemical reactions that occur in the troposphere and, above all, because they are precursors of the formation of tropospheric ozone (Figure 1). The sum of nitrogen oxide (NO) and nitrogen dioxide (NO2) is traditionally called NOx. These compounds are emitted into the atmosphere as a result of combustion processes due to human activity, such as thermal power plants, motor vehicles or other processes associated with industry, but they are also emitted in natural processes, such as the bacterial decomposition of organic nitrates, forest fires, biomass burning or volcanic activity
NO + O3 → NO2 + O2
NO2 + luz → NO + O
O + O2 → O3
Figure 1. Simplified process of the chemical reactions involved in the formation of tropospheric ozone. The light absorbed in the NO2 dissociation reaction is near UV radiation (λ <420nm).
In remote and high mountain locations, far from main emission sources, the concentration of nitrogenous oxides is much lower, which is why more sensitive and precise analysers are needed. Continuous measurements of NOx under these background conditions make it possible to detect regional and global changes in the composition of the atmosphere, which are related to the change in and control of anthropogenic emissions taking place in recent years as part of the air-quality and climate change policies applied.
These nitrogen compounds (NO, NO2 and NOx) have been measured at the Izaña Atmospheric Observatory of CIAI since 2006, within the Global Atmosphere Watch Programme (GAW) of the WMO for the measurement of Reactive Gases (Figure 2). The NOx analyser used to date had a detection limit greater than 50 ppt (parts per trillion). This analyser was able to measure pollution peaks during the day (values which are still very low compared to those registered in urban and rural areas) caused by the arrival of vehicles at the observatory or movement of vehicles and the use of machinery on the mountain of Izaña, and sporadically by the arrival of air masses from the marine boundary layer due to the break-up of the thermal inversion. However, at night, NO, NO2 and NOx concentrations remain below 50 ppt (background conditions), as can be confirmed by station-level tropospheric NO2 measurements made earlier in the day and at dusk with the MAX-DOAS remote sensing technique. Measurements made with the MAX-DOAS technique, which does not allow measurement at night since it needs light reflected in the sky, although it is actually the period of time in which the measurements would be representative of the background free troposphere, show concentrations of NO2 in the range of 20 – 45 ppt (Gil-Ojeda et al., 2015).
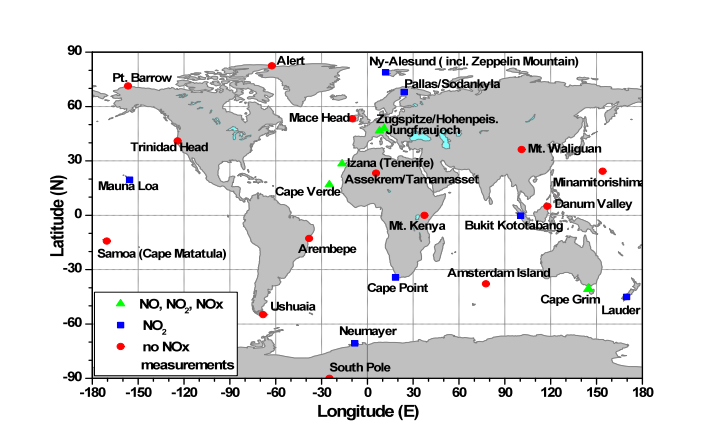
Figure 2. GAW stations operational at the end of 2009. The map indicates, with different symbols, the nitrogenous oxide compounds measured at the GAW stations. Information on the map was obtained from GAWSIS (GAW Station Information System). (Figure taken from GAW Report No.195, WMO 2011).
In order to lend continuity to the NOx measurement programme, improving the quality of measurements and increasing precision, the EcoPhysics CraNOx II analyser was acquired, as part of the project “Equipment for Monitoring and Research from the Global Atmospheric Watch station at Izaña (Tenerife) of Atmospheric Parameters and Components that modulate Climate Change (MICA)” (EQC2018-004376-P), funded by the State Program for the Generation of Knowledge and Scientific and Technological Strengthening of the RD&I System, the State Subprogram for Research Infrastructures and Scientific-Technical Equipment, within the framework of the State Plan for Scientific and Technical Research and Innovation 2017-2020.
At the beginning of October, and after the impossibility of it being installed earlier due to restrictions associated with Covid-19, technicians of Instrumentación Analítica S.A. (https://www.instru.es/) and EcoPhysics (https://www.ecophysics.com/), along with the staff at the centre, installed the CraNOx II analyser at the Izaña Atmospheric Observatory (Figure 3).
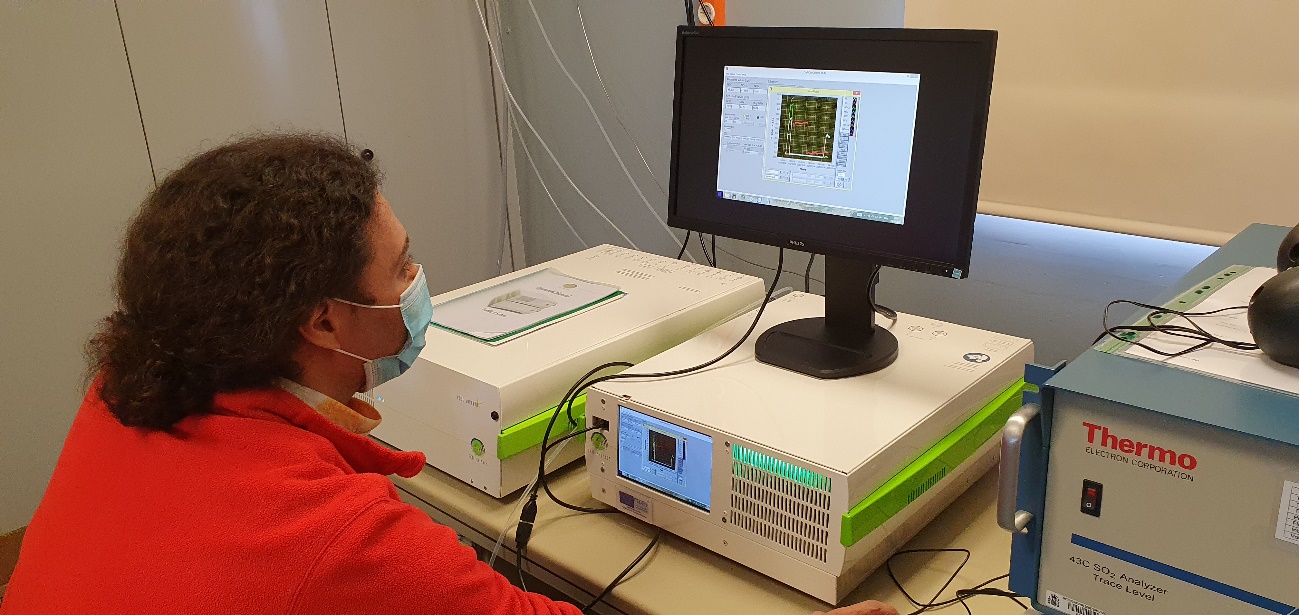
Figure 3. Start-up of the EcoPhysics CraNOx II analyser at the Izaña Atmospheric Observatory by Carlos Torres, head of the Reactive Gases and Ozonesonde Programme of the CIAI-AEMET.
The CraNOx analyser is a high-performance device that bases its measurement technique on a chemiluminescence detector (O3-CLD, Ozone Chemiluminescence Detection), which detects NO directly and NO2 after previously converting it into NO with a photolytic converter (PLC, Photolysis Converter). This NO measurement technique is recommended by GAW at its NOx measurement stations (WMO, 2011 and 2017) given its reliability, linearity and proven reproducibility in a wide range of conditions. The technique consists of enriching the air sample whose concentration of NO is to be studied with O3, which produces a set of reactions resulting in the generation of NO2 and the release of radiation proportional to the initial concentration of NO. This radiation is measured using a photomultiplier tube (PMT) and this will indicate how much NO there is in the initial sample.
On the other hand, to obtain the concentration of NO2 in the sample, all the NO2 must first be converted into NO, the same direct NO measurement process is repeated with the O3-CLD detector. There are several methods to produce NO2 from NO, e.g. using a photolytic converter or a heated molybdenum converter. In GAW stations, photolytic conversion is recommended (WMO, 2011) since it is a more selective method, avoiding the overestimation of NO2, by preventing other nitrogen compounds in the air from also transforming into NO during the process. The air sample is irradiated in a photolytic cell and a fraction of the NO2 is converted into NO, depending on an efficiency factor related to the intensity and type of lamp, e.g. mercury or xenon arc lamp or UV-LEDs.
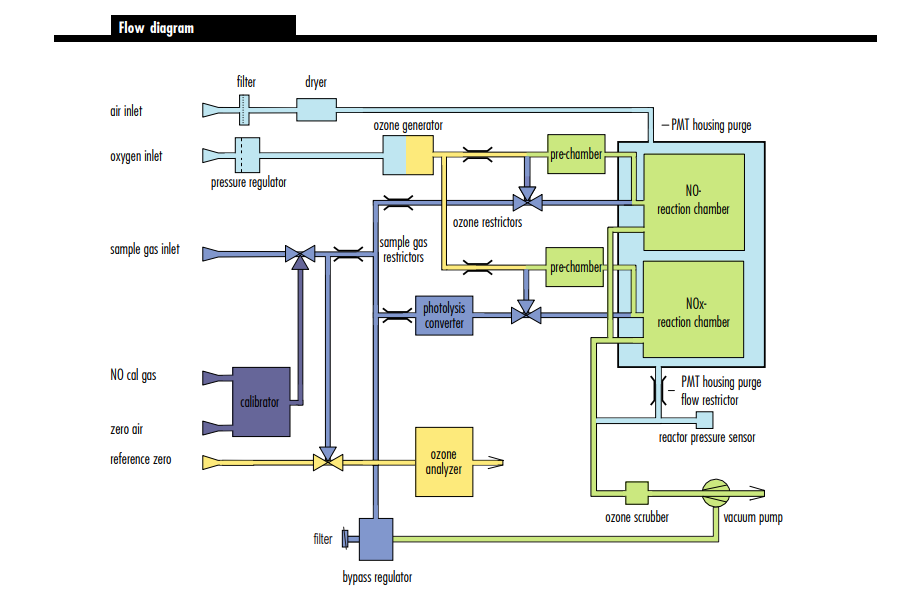
Figure 4. Internal diagram of the EcoPhysics CraNOx II analyser. (Source: https://www.ecophysics.com/environmental/supreme-line/cranox-ii/)
The CraNOx II installed in the Izaña Observatory complies with GAW recommendations in terms of measurement technique, precision and detection limit for the measurement of NO and NO2 in background conditions (WMO, 2011 and 2017). It is a compact instrument consisting of a double O3-CLD detector for the simultaneous measurement of NO and NOx, with a pre-chamber, to minimise interference due to the reaction of ozone with other compounds present in the air, and uses a photolytic converter (PLC) with a metal halide lamp (200W). For the ozone required in the O3-CLD chemiluminescence detector, the analyser has an internal ozone generator. This ozone is generated by applying an electrical discharge to a constant flow of oxygen (O2), taken from a bottle, breaking the O2 molecules down into more unstable atoms, which recombine to form ozone. Thanks to this design, the analyser allows the measurement of NO and NO2 concentrations below 25 ppt, with great stability and precision (Figure 5). The analyser also incorporates an internal calibration module that allows verification and zero-point calibration of the equipment, from the measurement of zero air (synthetic air previously passed through scrubbers to eliminate remains of other compounds), of the O3-CLD detector, with the measurement of a known dilute concentration of NO, and the efficiency of the PLC converter. The capacity to carry out these tasks automatically lends great reliability to the equipment as it allows control of both the quality of the measurement and of the equipment itself at all times. The CraNOx II is completed with an internal O3 analyser, by UV photometric absorption, which measures the O3 concentration of the air sample simultaneously with the NO and NO2 measurements, which will allow the detailed study of how the chemical reactions that connect these three compounds occur under background conditions.
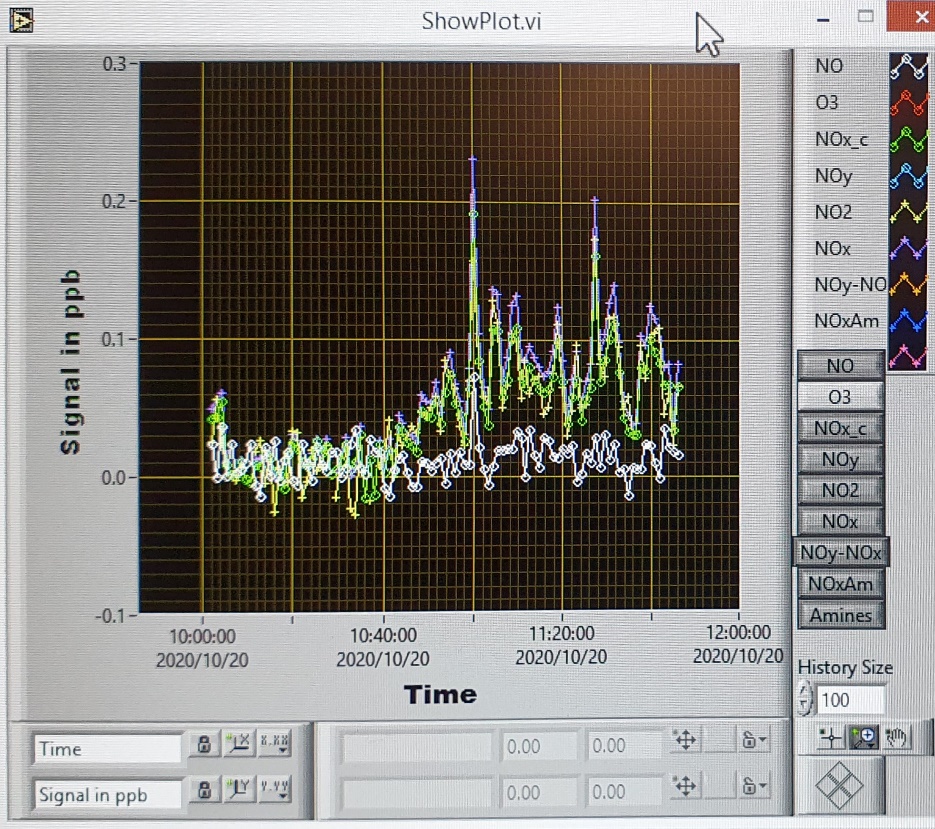
Figure 5. First NOx measurements taken at the Izaña Atmospheric Observatory with the CraNOx II analyser. The white line corresponds to the concentration of NO, the yellow line to NO2 and the purple line to NOx (NO + NO2) in ppb (parts per billion).
References:
Gil-Ojeda, M., Navarro-Comas, M., Gómez-Martín, L., Adame, J. A., Saiz-Lopez, A., Cuevas, C. A., González, Y., Puentedura, O., Cuevas, E., Lamarque, J.-F., Kinninson, D., and Tilmes, S.: NO2 seasonal evolution in the north subtropical free troposphere, Atmos. Chem. Phys., 15, 10567-10579, doi:10.5194/acp-15-10567-2015, 2015.
World Meteorological Organization, 2011: WMO/GAW Expert Workshop on Global Long-term Measurements of Nitrogen Oxides and Recommendations for GAW Nitrogen Oxides Network, Hohenpeissenberg, Germany, 8-9 October 2009, GAW Report 195, (WMO/TD-No. 1570), Geneva.
World Meteorological Organization, 2017: Report of the WMO/GAW Expert Meeting on Nitrogen Oxides and International Workshop on the Nitrogen Cycle, 12-14 April 2016, York, UK, GAW Report 232.