New paper published in Atmospheric Measurement Techniques Discussion entitled “Empirical validation and proof of added value of MUSICA’s tropospheric δD remote sensing products” by Schneider et al.
Within the project MUSICA (MUlti-platform remote Sensing of Isotopologues for investigating the Cycle of Atmospheric water) tropospheric water vapour isototopologue remote sensing and in-situ observations are carrying out. This paper presents a first empirical validation of MUSICA’s H2O and δD remote sensing products (generated from ground-based Fourier Transform InfraRed spectrometer, FTIR and a space-based Infrared Atmospheric Sounding Interferometer, IASI). As reference well calibrated in-situ measurements were used. One of these instruments was designed for aboard measurements (ISOWAT). Furthermore two commercial analyzers (Picarro L2120-I) that are continuously measuring water vapour isotopologues at 2 different locations at Tenerife (Izaña, 2370ma.s.l.; and at Teide, 3550ma.s.l.) were used.
The comparison to the ISOWAT profile measurements shows that the remote sensors can well capture the variations in the water vapour isotopologues, and the scatter with respect to the in-situ references suggests a δD random uncertainty for the FTIR product of much better than 45‰ in the lower troposphere and of about 15‰ for the middle troposphere. For the middle tropospheric IASI δD product the study suggests a respective uncertainty of about 15 ‰. In addition, we find indications for a positive δD bias in the remote sensing products.
The δD data are scientifically interesting only if they add information to the H2O observations. We are able to qualitatively demonstrate the added value of the MUSICA δD remote sensing data by comparing δD -vs.-H2O curves. It is demonstrated that the added value of δD as seen by the in-situ instruments is similarly seen in the remote sensing instruments for coincident measurements. A good example is the different isotopic fingerprints showed in the data collected for the different instruments that allow identifying the main transport pathways of airmasses in the subtropical North Atlantic troposphere.
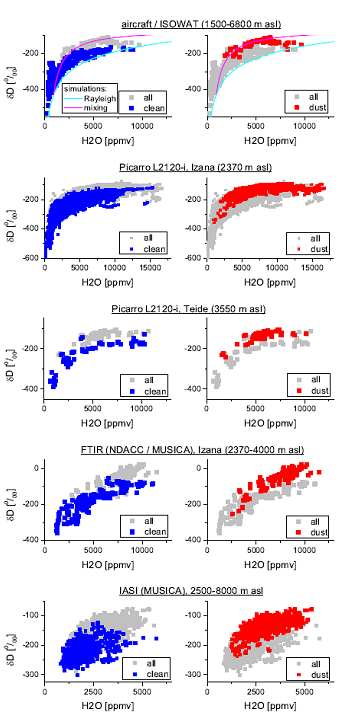
Figure1: δD -vs.-H2O plot observed from May to October at and close to Tenerife by different instruments. Gray dots: all data; blue dots: for airmass clearly not affected by the African dust; red dots: for airmass with dust laden, thus, clearly affected by strong vertical mixing over the African continent. In addition the top panels show two simulated curves. Magenta line: mixing with end member 1) H2O=25000 ppmv; δD=−80‰ and 2) H2O=900 ppmv; δD]=−430 ‰; cyan line: Rayleigh curve for sea surface initial conditions of T=25C and RH=80 %.
For more details about this work please refer to: Schneider, M., González, Y., Dyroff, C., Christner, E., Wiegele, A., Barthlott, S., García, O. E., Sepúlveda, E., Hase, F., Andrey, J., Blumenstock, T., Guirado, C., Ramos, R., and Rodríguez, S.: Empirical validation and proof of added value of MUSICA’s tropospheric δD remote sensing products, Atmos. Meas. Tech. Discuss., 7, 6917-6969, doi:10.5194/amtd-7-6917-2014, 2014. http://www.atmos-meas-tech-discuss.net/7/6917/2014/amtd-7-6917-2014.html