Historical record of atmospheric CO₂ levels at the Izaña Atmospheric Observatory in 2025

Clic here for spanish version
The atmospheric CO₂ concentration measured at the Izaña Atmospheric Observatory (IZO), which is part of the Izaña Atmospheric Research Center (IARC) of the State Meteorological Agency of Spain (AEMET), reached a monthly average of 430.6 ppm (parts per million by volume) in May 2025. This value likely represents the peak background CO₂ concentration measurement for the year 2025 and marks the highest level in the station’s historical record.
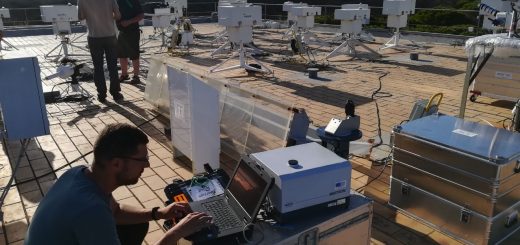
IZO is part of the surface station network of the Global Atmosphere Watch (GAW) programme of the World Meteorological Organization (WMO). This programme coordinates high-quality observations of atmospheric composition at both global and local scales, with participation from around 100 countries. The WMO publishes an annual Greenhouse Gas (GHG) Bulletin (WMO, 2024) reporting on the state of GHGs in the atmosphere based on the most recent GAW observations. Among other data, it presents globally averaged surface concentrations of major GHGs and compares them with values from previous years and pre-industrial levels. IZO is one of the most important GAW stations, as it is located on a plateau in Tenerife at an altitude of 2373 metres, typically above a well-established thermal inversion layer. These conditions make the observatory especially well-suited for measuring background GHG concentrations in the free troposphere.
Figure 1 shows the time series of monthly average atmospheric CO₂ concentrations (mole fraction by volume) measured at IZO since 1984 using various spectroscopic techniques. The visible annual oscillation reflects increased photosynthetic activity during the boreal summer, which leads to a CO₂ maximum in spring. The trend line is derived by removing this seasonal cycle using the data fitting and filtering method developed by the Global Monitoring Laboratory of the National Oceanic and Atmospheric Administration (NOAA; Thoning et al., 1989). The baseline is obtained using the same method by filtering out all cycles with periods shorter than one year, which are attributed to short- or mid-term variability superimposed on the background signal. The monthly concentration values lie very close to the baseline because these averages -based on clean air samples, generally from the free troposphere- are representative of background levels. Likewise, the annual mean values, which are not shown in the figure, would lie very close to the trend line. While the seasonal cycle is relatively stable and of natural origin, the trend line shows a clear increase attributable to anthropogenic emissions.
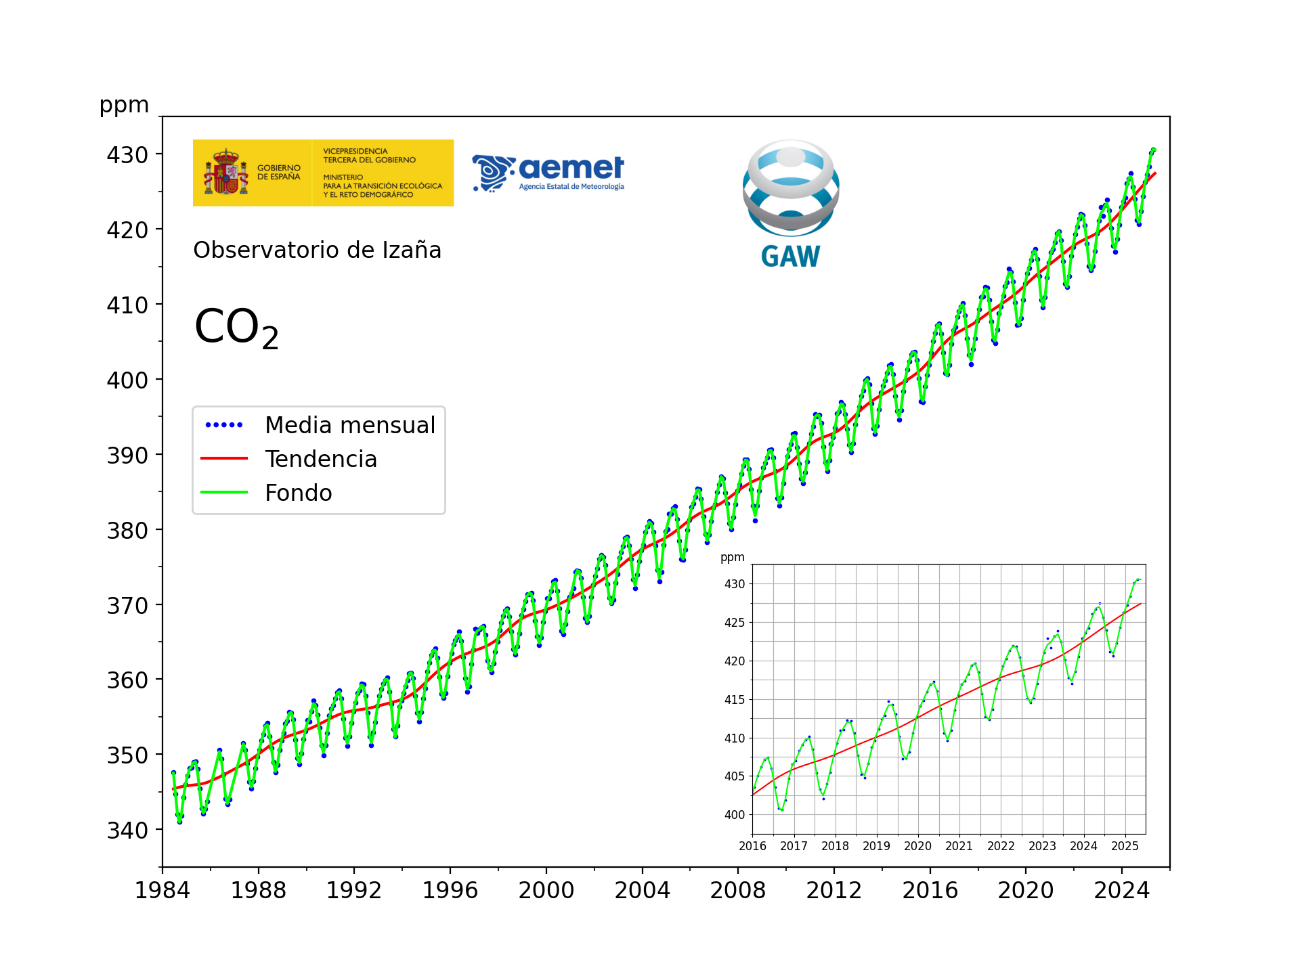
Figure 1. Monthly mean values (blue), trend line (red) and baseline (green) of atmospheric CO₂ concentration at IZO. The enlarged panel in the bottom right corner provides a detailed view of the data over the past decade.
The location of IZO results in average CO₂ values that closely match global averages. For this reason, the most recent CO₂ increases observed at Izaña generally serve as a good proxy for the global annual increases subsequently reported in the WMO GHG Bulletins. Figure 2 shows annual average increases at IZO compared with those from the most recent GHG bulletin. The graph reveals a persistent annual increase in CO₂ since the 1980s, with an average rate of +2 ppm per year. This growth rate has tended to accelerate, reaching an average of +2.4 ppm per year over the past decade.
Between 2022 and 2023, the global annual mean atmospheric CO₂ rose by 2.3 ppm, and the annual average at Izaña increased by the same amount. In contrast, in 2024 the annual mean at Izaña increased by 3.4 ppm. These year-to-year variations in the CO₂ growth rate are strongly influenced by the El Niño–Southern Oscillation climate phenomenon. During its warm phase, El Niño, atmospheric CO₂ concentrations tend to increase more rapidly, while the cold phase, La Niña, is typically associated with more moderate growth rates. In May 2023, a transition occurred from a prolonged La Niña episode, lasting nearly three years and associated with relatively moderate CO₂ growth, towards an El Niño phase. This shift may explain the accelerated growth observed after 2023 at IZO.
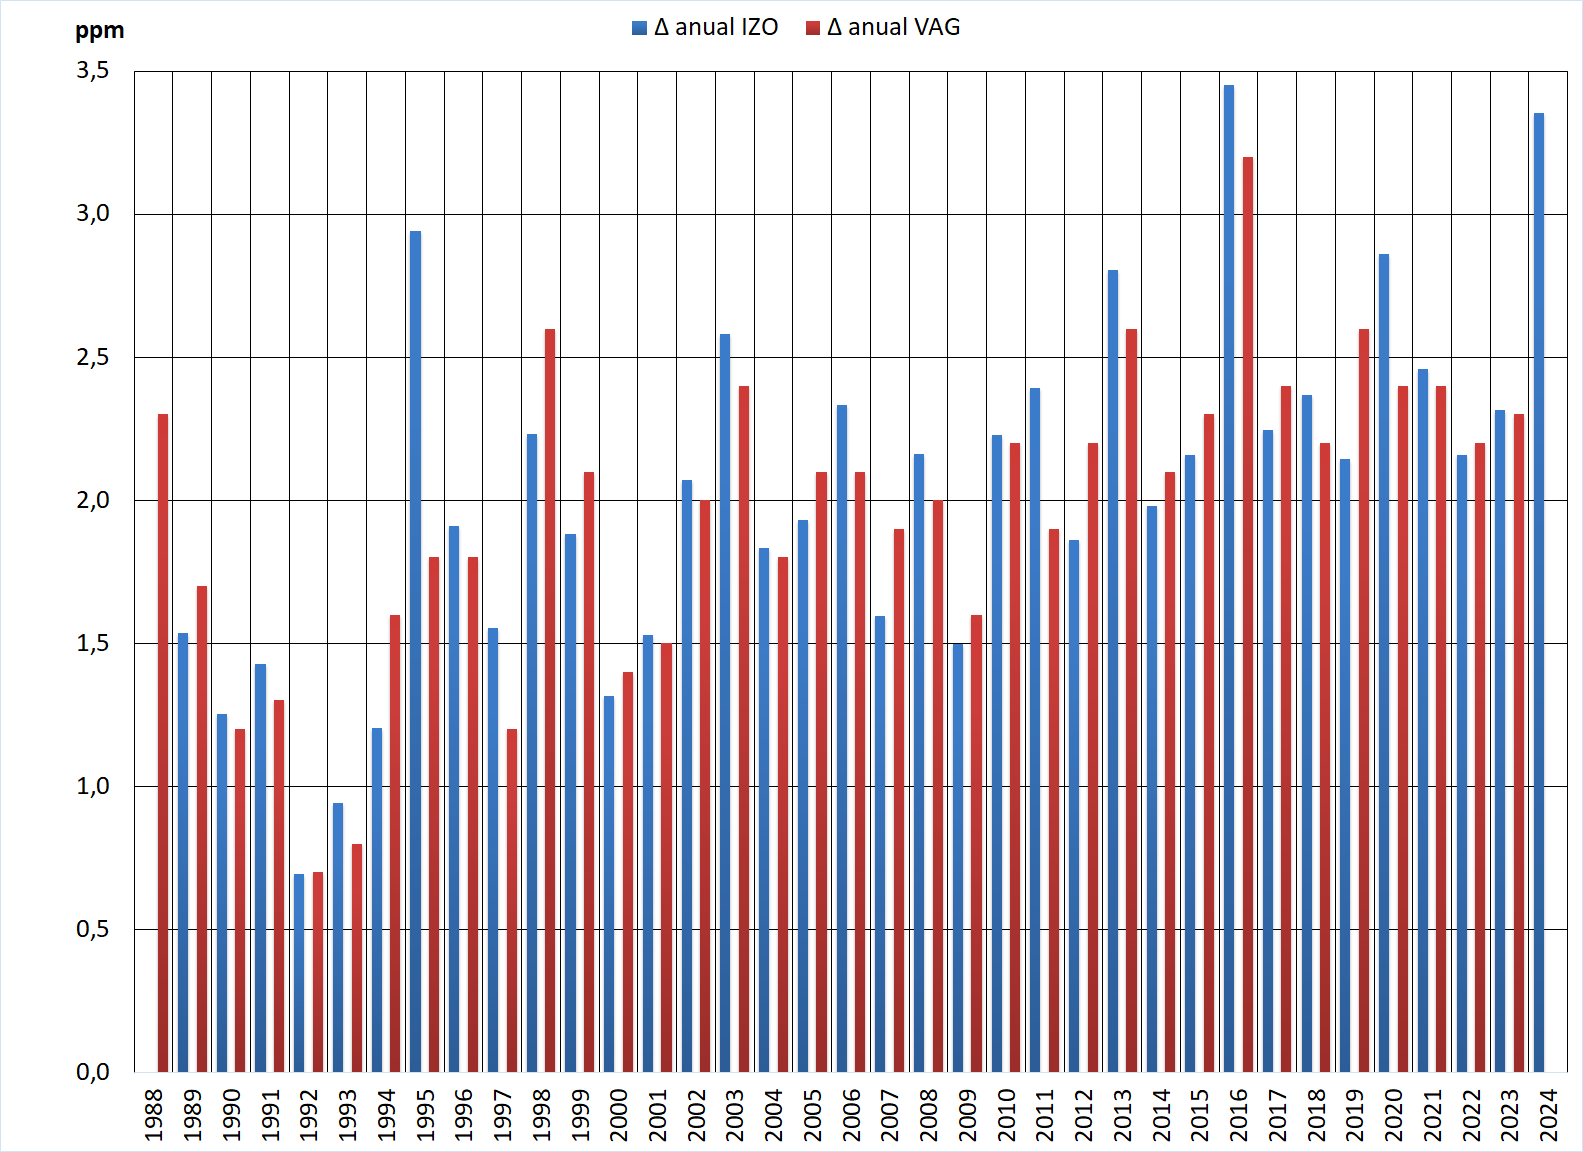
Figure 2. Annual increases in atmospheric CO₂ concentration relative to the previous year, based on measurements at IZO (blue) and on the global averages derived from the surface station network of the GAW programme (red).
During the past year, 2024, the monthly maximum at IZO was also reached in May, with a value of 427.4 ppm. Therefore, the difference between the current year’s and the previous year’s maximum is 3.1 ppm. Even more significant is the increase in the interannual average over the last 12 months: between June 2024 and May 2025, the mean concentration grew by 3.6 ppm compared to the same period one year earlier. Figure 3 displays both the annual average increases at IZO and the interannual increases calculated for 12-month periods spanning from June to May of the following year. This representation highlights the acceleration in CO₂ growth at IZO starting from a clear inflection point in mid-2022, during the La Niña phase, when CO₂ rose by only 1.7 ppm per year. This inflection point is also visible in the trend line within the enlarged section of Figure 1. The envelope curve connecting the bars in Figure 3 roughly represents the first derivative of the trend line shown in Figure 1.
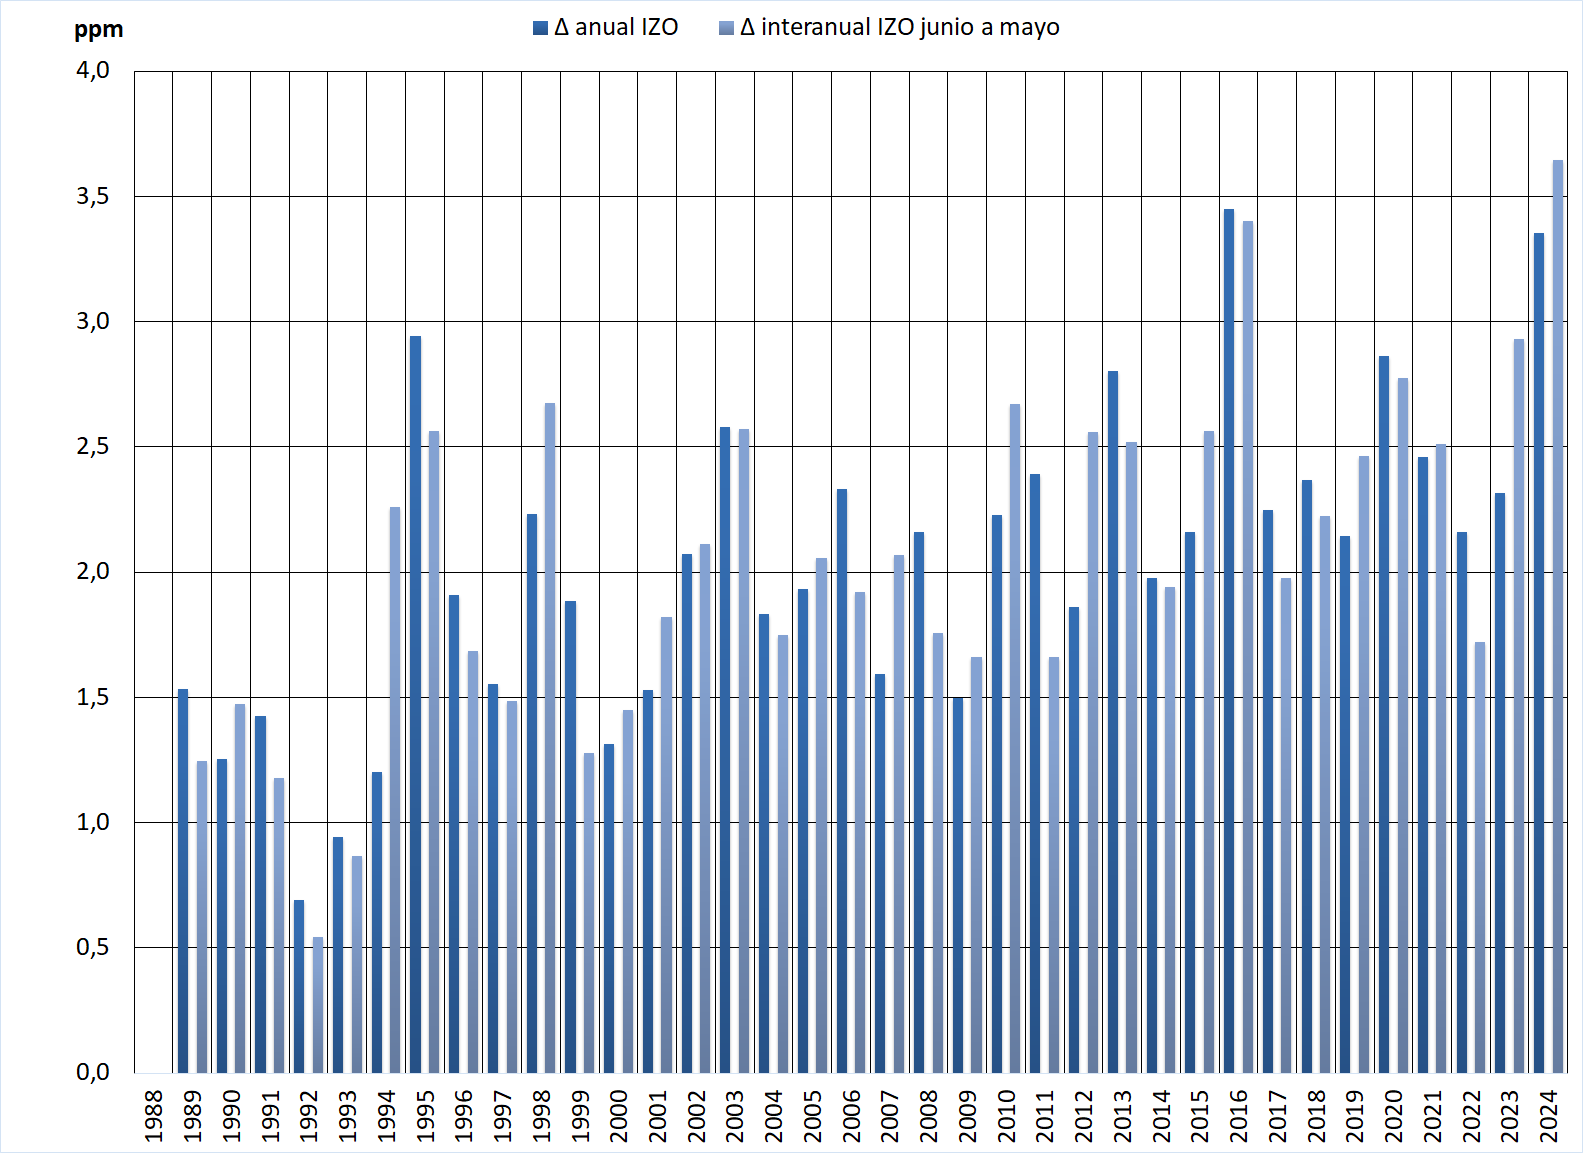
Figure 3. Increases in the annual averages (January to December) of atmospheric CO₂ concentration at IZO relative to the previous year (dark-colored bars), and increases in the interannual averages (June to May of the following year) relative to the preceding equivalent period (light-colored bars).
References:
Thoning, K.W., P.P. Tans, and W.D. Komhyr; Atmospheric carbon dioxide at Mauna Loa Observatory, 2. Analysis of the NOAA/GMCC data, 1974 1985. J. Geophys. Res., 94, 8549 8565, 1989.
WMO (2024). Greenhouse Gas Bulletin (GHG Bulletin), No. 20: The State of Greenhouse Gases in the Atmosphere Based on Global Observations through 2023. https://library.wmo.int/idurl/4/69057.