The Izaña Observatory is recognized by the World Meteorological Organization as a centennial station of great importance for the study of natural climate variability and climate change
![]()
![]()
The Izaña Observatory is officially one of the centennial stations recognized by the World Meteorological Organization (WMO) for its importance in the study of climate and climate change (Right-click on each image to download it).
The Intergovernmental Panel on Climate Change (IPCC) Fifth Assessment Report (AR5 WGI) confirms that it is extremely likely that human influence has been the dominant cause of the observed warming since the mid-20th century. The evidence for this has grown, thanks to more and better observations, an improved understanding of the climate system response and climate models.
Long-term observations and in particular those from observing stations that provide continuous data for 100 years or more (centennial observing stations) are crucial for documenting and analyzing long-term variations of the Earth’ climate on multi-decadal to centennial timescale, thereby providing useful input to relevant climate research and services, and beyond.
The May 2017 WMO Executive Council meeting recognized a first set of 60 WMO centennial observing stations to highlight their role and to assist member countries in maintaining them, as some are in Risk of closure or loss of basic observational standards. Of these 60 stations recognized by WMO, four are Spanish, and one of them is that of the Izaña Observatory in Tenerife.
The enormous importance of the Izaña series is due to several factors: the high quality of the observations, the fact that they are uninterrupted observations for 100 years, except for very short periods of time due to logistical and infrastructural problems, and the exceptional location of the Observatory.
The Izaña Observatory, being located in a high mountain, in a remote place of the subtropical North Atlantic, above the temperature inversion associated with the trade winds, makes its observations are representative of the background conditions of the subtropical low troposphere, and therefore they correspond to a huge region that extends by the subtropical belt of the North Atlantic. That is, the seasonal, interannual and interdecadal variations of their records account for natural climate variability and climate change in the purest state of the subtropical free troposphere. This is an added value compared to other centennial stations whose records are very affected by local and regional conditions or by changes experienced in their corresponding environments in the last decades.
The long term series of temperature (Figura 1) are being used to explore aspects of interdecadal variations in the atmosphere, and to assess the global warming which is particularly evident from the 80s.
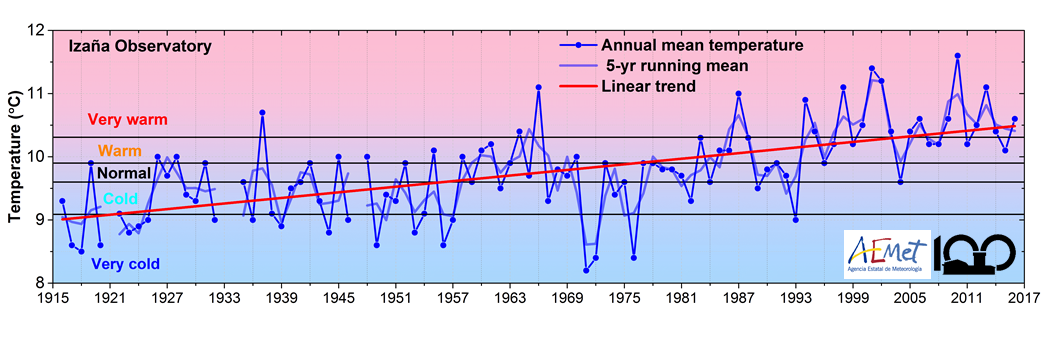
Figure 1; 101-year time series (1916-2016) of annual average temperature (°C) at the Izaña Observatory. Click on the image to download a graph at higher resolution.
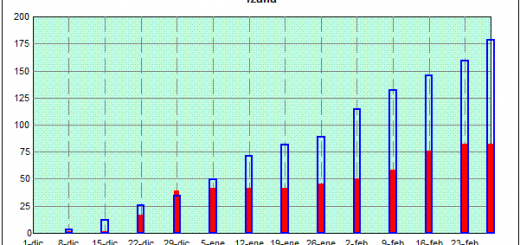
The long term precipitation series (Figure 2) allows us to know, in addition to the inter-annual and interdecadal variations, and their relation with climate indexes, changes in seasonality and rainfall intensity, as well as in the distribution of dry and wet periods.

Figure 2; 101-year time series (1916-2016) of annual precipitation (mm) at the Izaña Observatory. Click on the image to download a graph at higher resolution.
The long term series of atmospheric pressure (Figure 3) is an excellent indicator of interdecadal variations in intensity and position experienced by large pressure systems on the North Atlantic (e.g. the Azores anticyclone) and North Africa (e.g. the North African anticyclone), which in turn are modulated by long period variations of the Atlantic Ocean temperature.
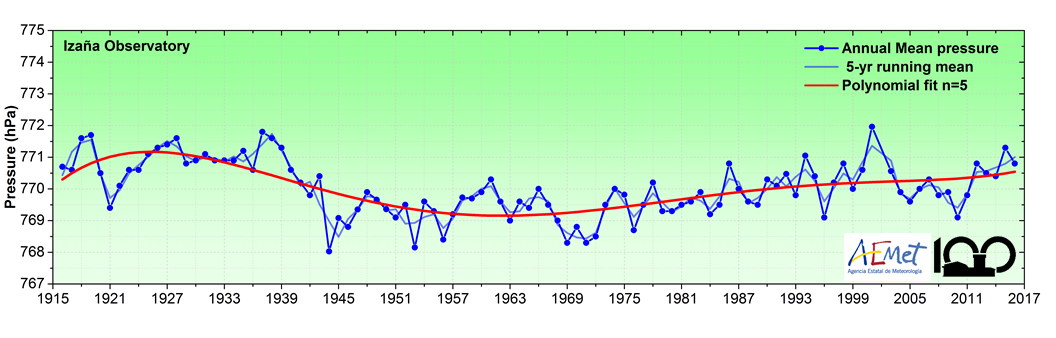
Figure 3; 101-years time series (1916-2016) of annual average atmospheric pressure (hPa) at the Izaña Observatory. Click on the image to download a graph at higher resolution.
The long term series of relative humidity (Figure 4), strongly driven by temperature variations, is used to analyze a possible shift of the tropical / sub-tropical belt to higher latitudes.

Figure 4; 101-year time series (1916-2016) of annual average relative humidity (%) at the Izaña Observatory. Click on the image to download a graph at higher resolution.
The interesting long time term series of sunshine duration (Figure 5) allows us to reconstruct radiation and aerosol optical thickness long term series, which in turn are used to detect and assess the effect of volcanic aerosols (eruptions Chichón and Pinatubo) on the climate, and the impact of anthropogenic aerosols, such as so-called global darkening and global brightening.
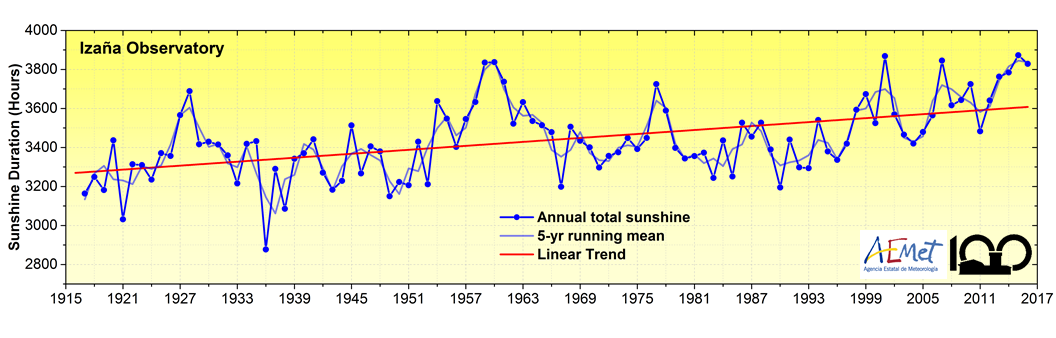
Figure 5; 101-year time-series (1916-2016) of annual sunshine duration (h) at the Izaña Observatory. Click on the image to download a graph at higher resolution.
These series, which can be downloaded with higher resolution by clicking on them, constitute a valuable treasure for studies of natural climate variability and climate change in the subtropical region, a key region in which multiple exchange processes occur between the equatorial region and mid-latitudes, as well as between the troposphere and the stratosphere.