The Sedov Russian sailing ship encounters an African dust cloud during its trip to the Canary Islands
The Sedov Russian sailing ship encounters an African dust cloud during its trip to the Canary Islands
The “Sedov” Russian sailing ship, which is performing its first world circumnavigation, has arrived at the Santa Cruz de Tenerife port on May, 31 morning, coming from Dakar (Senegal). Its arrival was delayed by 12s hour because of the presence of two opposite oceanic currents (Moroccan and Canarian) and strong winds in the opposite direction to its motion, with speeds ranging between 18 and 20 meters per second. As reported by Captain Nikolai Zorchenko, “periodically the wind began to blow from the continent, bringing from Morocco the clouds of sand”. A motionless ocean and dust over the ocean…this was the scene found by the Sadov before arriving to Tenerife.
Captain Zorchenko said that during the sunrise they could look at the sun, which looked like a full moon, which was fascinating until the dust began to provoke tickle in the throat, eye discomfort and teeth squeak. At that point they started to realize “how close is Africa with its sands”. (Source: http://eng.mstu.edu.ru/sedov/news/30-05-2013/Sedov_ship_will_sail_into_tenerife_day_later.shtml )
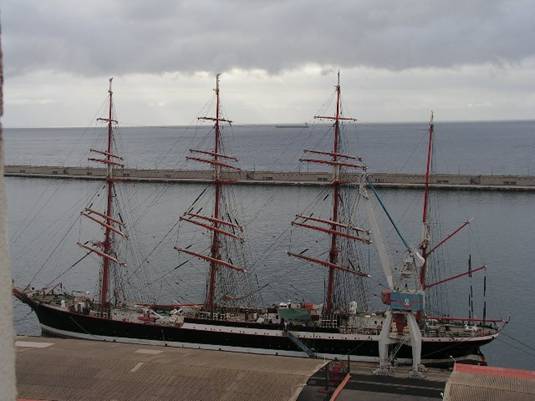
Figure 1. The Sedov sailing ship at the Santa Cruz de Tenerife port on May, 31th, 2013, after sailing “through the dust cloud”. Photo by: Silvia Alonso from Izaña Atmospheric Research Center (AEMET) Headquarters.
The MODIS (NASA) image from May, 24th, 2013 shows the presence of airborne dust over the Atlantic Ocean in areas coinciding with the Sedov’s path (Fig.1). Figures 3, 4, 5 and 6 show different products simulated by the dust-model ensemble shown by the WMO SDS-WAS Regional Center for Norther Africa, Middle East and Europe (http://sds-was.aemet.es/)and NMMB / BSC-Dust dust models. The values of dust optical depth (DOD), total dust load and surface dust concentration indicate models correctly predicted the presence of airborne dust on areas of the Sadov sailing route. The MSG satellite images (Fig. 7) show that the dust source area was actually located in areas of southern Mauritania and Mali. Figures 3, 4, 5 and 6 show that the SDS-WAS WMO and NMMB / BSC-Dust models anticipated higher dust concentration at surface level, DOD and total dust load in these source areas.
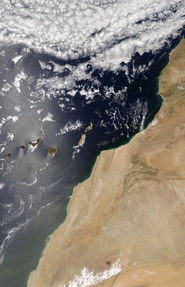
Figure 2. MODIS image (NASA). May 24th, 2013.
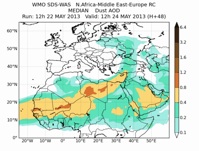
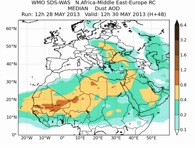
Figure 3. DOD simulated by the WMO SDS-WAS multi-model for 24th (left) and 30th (right) May, 2013.
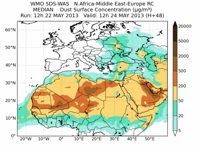
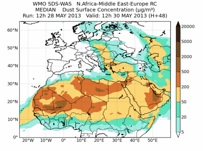
Figure 4. Dust surface concentration (µg/m3) simulated by the WMO SDAS-WAS multi-model for 24th (left) and 30th (right) May, 2013.
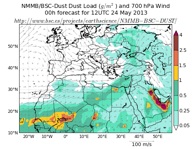
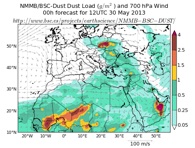
Figure 5. DOD forecasting provided by NMMB/BSC-Dust model for May 24th (left) and May 30th (right), 2013.
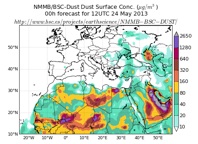
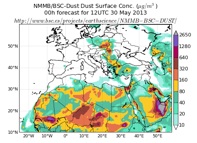
Figure 6. Surface dust concentration (µg/m3) forecasted by NMMB/BSC-Dust model model for May 24th (left) and May 30th (right), 2013.
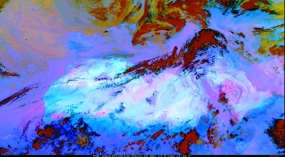
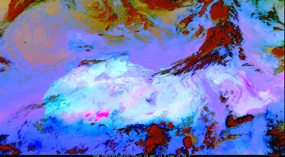
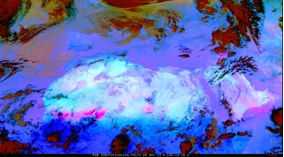
Figure 7. MSG images with dust in pink color, for May 23th (upper panel), May 24th (center) and May 25th, 2013.