
Thermal and rainfall behaviour analysis of winter 2017-18 at Izaña Observatory
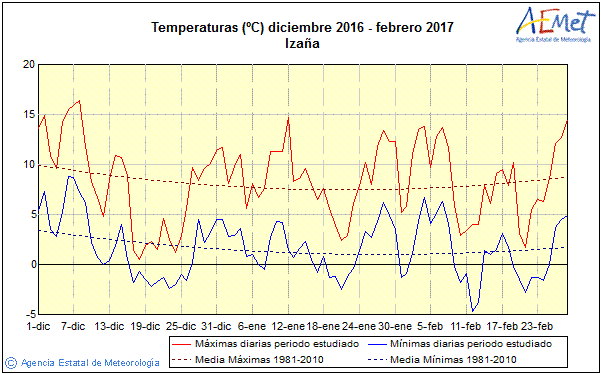
During the 3 main months of the past winter, the Izaña Observatory underwent several periods of different thermal behaviours. In the following figures, it is observed how the highest and lowest temperatures varied during the last winter (left) and during the period from December 2016 to February 2017 (right).
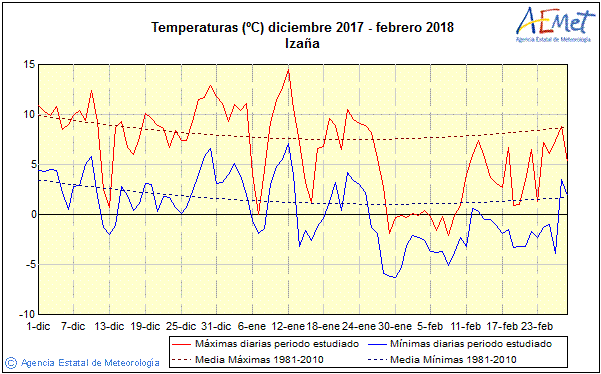
From December 2017 to January 2018, the highest and lowest temperature were close to corresponding average levels registered on the 1981-2010 period. However, there were some exceptional registers during this time: On December 13th and on January 7th there were anomalous cold temperature records, and on December 30th and on January 12th, unusual warm temperatures were registered. Consequently, these months show normal averaged monthly temperature values as regards the climatic reference series: December 2017 had 5.7ºC as the average temperature, coinciding with the average temperature of the 1981-2010 period; January 2018 had an average temperature slightly lower than the previous one.
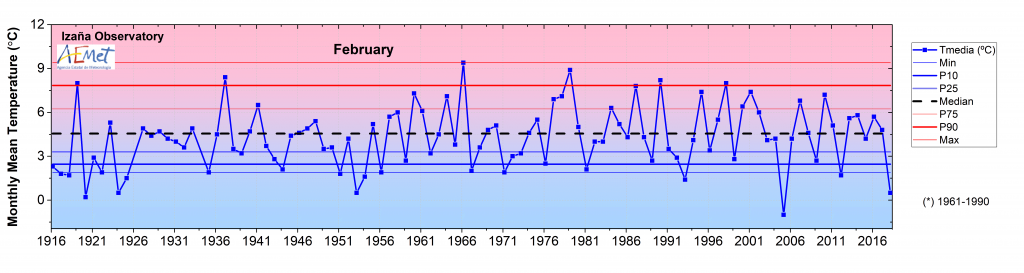
Nevertheless, there was a very cold event that began at the end of January and lasted nearly two weeks. In this period of time, temperatures remained below 0ºC all day and almost without any interruption. Later, although on February 11th there was a significant temperature rise, these very low temperature records continued to be below the 1981-2010 average until the end of the month. As a result, the February 2018 monthly temperature was unusually cold, having an average value of 0.5 ºC. This average temperature is clearly below the 1961-1990 mean temperature, as it is depicted in the following figure. Actually, this average temperature is the second lowest historical value registered on the climatic series at Izaña Observatory since 1916, and it is only below the absolute record of -1.0ºC registered on February 2005.
Regarding the rainfall during the winter trimester, a comparison between weekly rainfall accumulation at Izaña since 1 December (red bars) and the average rainfall accumulation of the 1981-2010 period (blue bars) are depicted in the following figures. The left figure represents the mentioned period of the 2017-18 winter, and the right figure alludes to the same period of time of the 2016-17 winter.

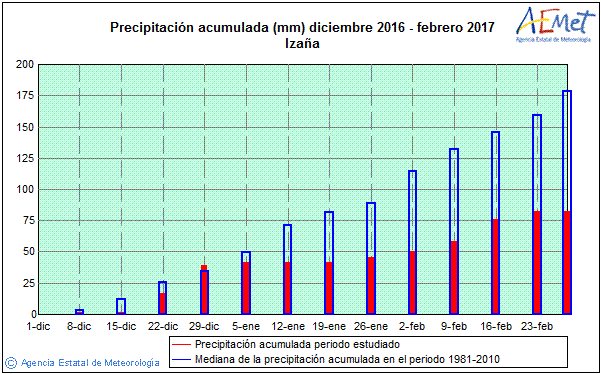
Since December 2017 there was a rainfall surplus with respect to the 1981-2010 period. On the contrary, during the 2016-17 winter, there was a rainfall shortage for the most part of the trimester. The final balance from December 2017 to February 2018 is positive, with 254 mm as an accumulative value: this value means a rainfall surplus of about 75 mm over the reference values of 1981-2010 period, and more than 50 mm rainfall surplus above the average value of 191.5 mm registered on the same period.
Translated by Yaiza Aguilar, ULL trainee student; supervised by IARC staff.