Update of the Carbon Dioxide and Methane atmospheric series of Izaña (1984-2010)
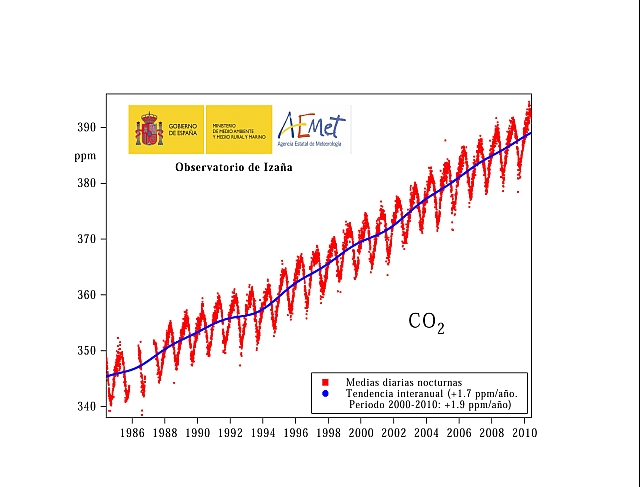
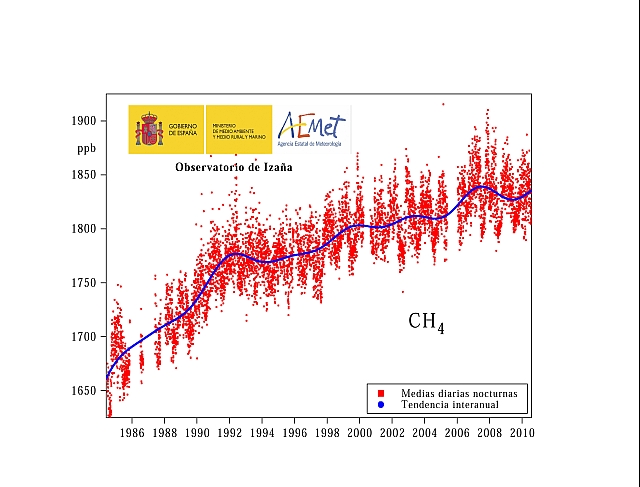
The graphics (click inside the graphics to see them at a larger size) show the molecular mixing ratios of atmospheric carbon dioxide (CO2) and methane (CH4) measured (daily means of the night period) at Izaña Atmospheric Observatory, from 1984 till present. During the night period, the atmospheric measurements at Izaña are representative of the free troposphere conditions, because during such period, the observatory is not affected by the local and regional sources of such gases (during daytime there can be a very small influence of them).
CO2 (and CH4) data are expressed in molecular mixing ratio in dry air, defined as the number of molecules of this gas divided by the total number of air molecules excluded the water vapour molecules. The molecular mixing ratio is expressed in parts per million (ppm) or in parts per billion (ppb); for example, 1,800 ppb of CH4, means 1,800 molecules of methane per every thousand of millions of dry air molecules. The daily mean values for the night period are plotted as red squares, whereas the blue line shows the interannual trend.
The atmospheric CO2 and CH4 increases produced by anthropogenic emissions (due to the use of fossil fuels and changes in the use of lands), are producing an increase of the atmospheric greenhouse effect, which is causing a climatic change. The radiative forcing produced by the increase in CO2 is approximately three times larger than that produced by the increase in CH4. To interpretate the graphics appropriately, it should be taken into account the molecular mixing ratios before the industrial revolution: 280 ppm of CO2, and 715 ppb of CH4. The present atmospheric values of CO2 and CH4 are by far the largest during last 650,000 years (IPCC 2007).
Atmospheric CO2 continues growing at an increasing rate (1.9 ppm/year of mean during the last ten years, whereas the mean for the whole period of measurements at Izaña, 1984-2010, is 1.7 ppm/year). Atmospheric CH4 has started to increase again after a relatively stable period between the years 2000 and 2006.