Izaña’s updated CO2 Series (May 28th, 2009)
Izaña’s updated CO2 Series (May 28th, 2009)
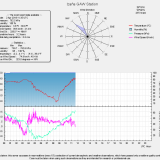
The Izaña Observatory’s carbon dioxide series has been updated on May 28. [CO2 plot].
The graph shows the nigh-time daily mean carbon dioxide (CO2) data measured at Izaña Observatory, at an altitude of 2360 m in the North Atlantic subtropical region, since 1984. We assure atmospheric measurements correspond to free troposphere conditions in the night period, when the Observatory is not affected by local or regional pollution.
CO2 data is reported as a dry air mole fraction defined as the number of molecules of CO2 divided by the number of all molecules in air after water vapor has been removed. The mole fraction is expressed as parts per million (ppm). Example: 0.000380 is expressed as 380 ppm.CO2 night-time daily means are plotted in red squares. The blue line shows the CO2 inter-annual trend with 1.7ppm/year for the whole period. The growth rate is significantly higher (1.9 ppm/year) in the last period (1999-2009).


