Record atmospheric CO₂ concentration at the Izaña Observatory in 2026



The atmospheric CO2 concentration measured in situ at the Izaña Observatory (IZO), operated by the Izaña Atmospheric Research Center (CIAI) of the State Meteorological Agency (AEMET), reached a monthly average of 432.3 ppm (parts per million by volume) in March and May 2026. Since atmospheric CO2 typically decreases during the summer, this value can be considered the maximum background CO2 concentration for 2026, and it is the highest value in the historical record.
IZO is part of the network of surface stations of the Global Atmosphere Watch (GAW) programme of the World Meteorological Organization (WMO). This programme coordinates high-quality observations of atmospheric composition at global and local scales, with the participation of about 100 countries. Every year, the WMO publishes a Greenhouse Gas Bulletin (WMO, 2025), which assesses the state of greenhouse gases (GHGs) in the atmosphere based on the most recent observations from the GAW programme. Among other things, it contains the surface concentrations of the main GHGs, averaged globally, and compares them with those of previous years and with pre-industrial levels. IZO is located on a plateau in Tenerife at an altitude of 2373 m, normally above a well-established thermal inversion layer, conditions that make this observatory an ideal place to measure background GHG concentrations in the free troposphere.
Figure 1 shows the monthly mean atmospheric CO2 mole fraction (expressed as a volume concentration) measured at IZO since 1984 using several spectroscopic techniques. The visible annual oscillation is due to the increase in photosynthetic activity in the boreal summer, which produces a maximum of CO2 in spring. The trend line results from the elimination of this seasonal cycle through the data fitting and filtering method used in the Global Monitoring Laboratory (National Oceanic and Atmospheric Administration, NOAA) (Thoning et al., 1989). The baseline is obtained with the same method by removing signals with periods shorter than one year, as they are considered small or medium-scale variations that are superimposed on the atmospheric background values. The points representing the monthly concentrations are very close to the baseline because the monthly averages are derived from clean-air measurements generally representative of the free troposphere. Likewise, the annual averages (not shown in the graph) would be very close to the trend line. While the seasonal variation is fairly stable and has a natural origin, the trend line shows a clear increase attributable to anthropogenic emissions.
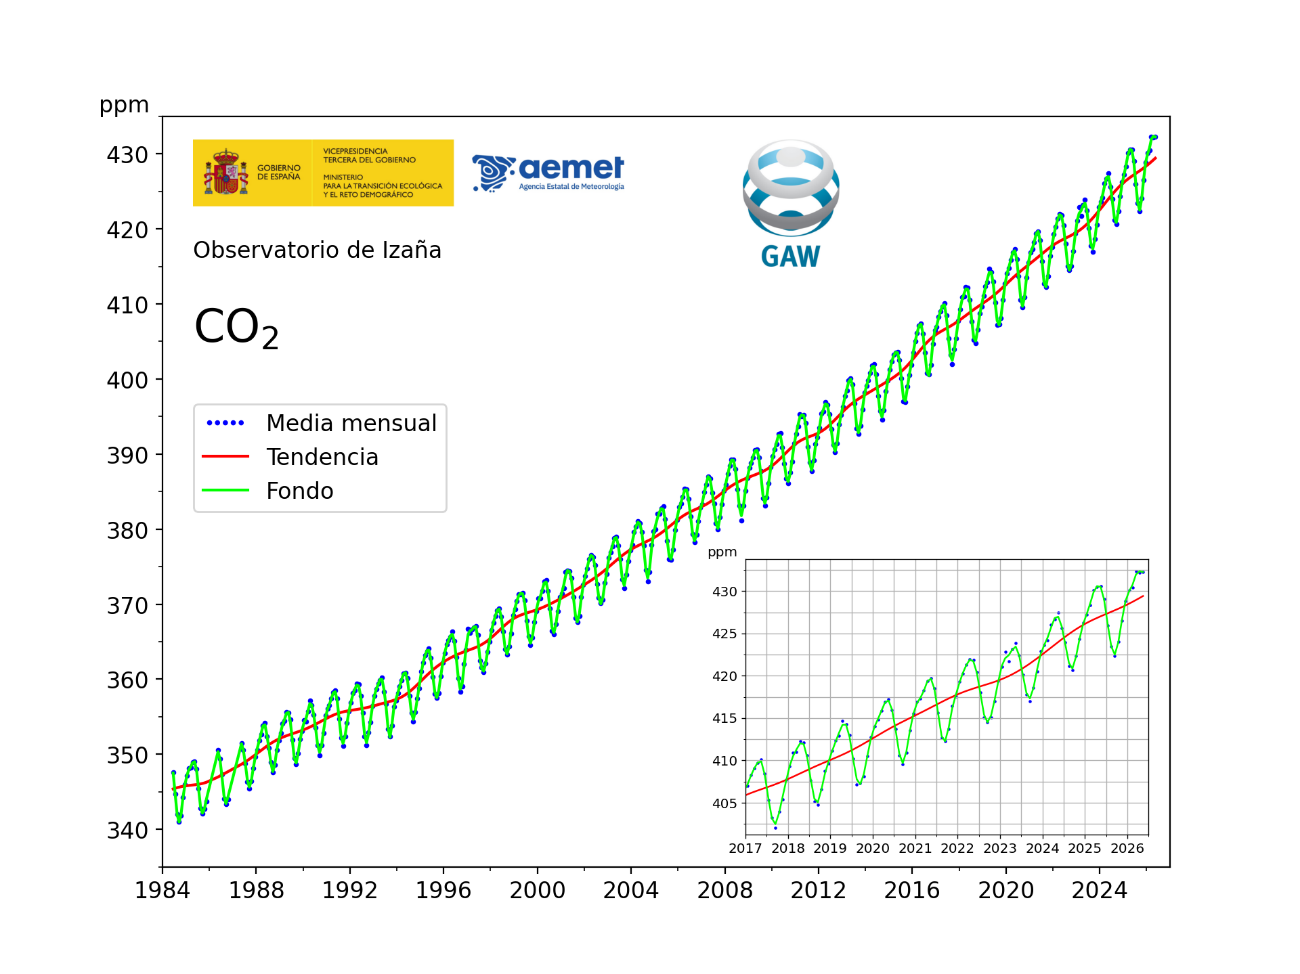
Figure 1. Monthly mean (blue), trend line (red), and background value (green) of the atmospheric CO2 concentration at the Izaña Observatory. The inset in the lower-right corner shows the concentrations over the last decade in detail.
IZO’s location makes its average measurements similar to global averages. For this reason, the most recent increases in the CO2 concentration measured at Izaña generally provide a good indication of the increases in the global annual means published in the WMO GHG Bulletins. Figure 2 shows the increases in the annual means at IZO compared to those of the global annual averages reported in the latest GHG Bulletin. The graph shows persistent CO2 growth since the 1980s, with an average rate of +2 ppm/year. This growth rate shows a tendency to increase, with +2.6 ppm/year being the average rate of the last decade.
Between 2023 and 2024, the annual mean CO2 concentration in the global atmosphere increased by 3.5 ppm, while the annual mean at Izaña increased by 3.4 ppm. This is a very large increase, which may be related to the increase in CO2 emissions from wildfires, exceptionally high in South America during 2024. In contrast, in 2025 the annual mean at Izaña increased by 2.9 ppm, and the cross-year average over the last 12 months (from June 2025 to May 2026) increased by only 2.2 ppm relative to the corresponding average of the previous 12 months. The maximum monthly average in IZO during 2025 was reached in May, with 430.6 ppm, so the difference between this year’s maximum and last year’s maximum was 1.7 ppm.
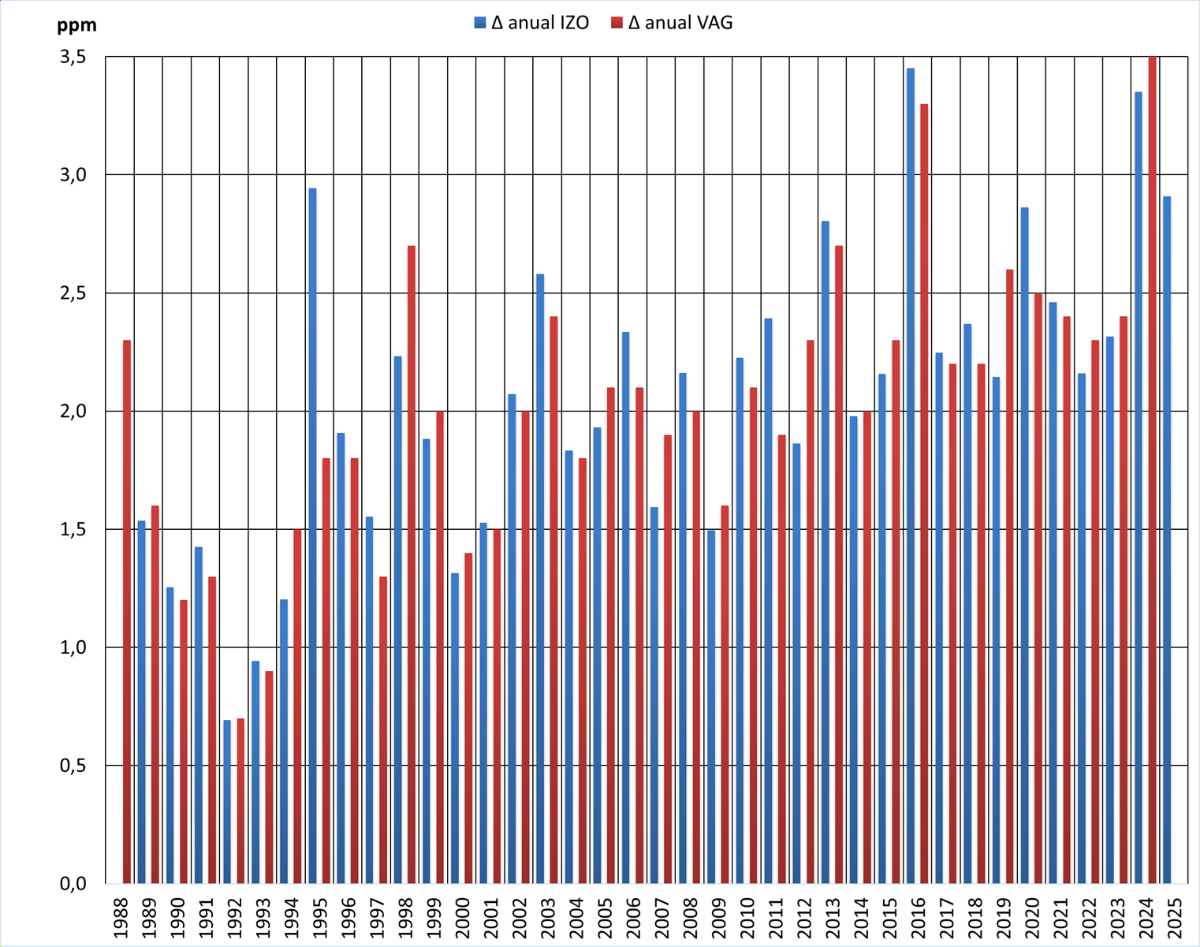
Figure 2. Increases in annual-mean atmospheric CO2 concentration relative to the previous year, according to measurements made at IZO (blue) and according to the set of observations from the GAW surface station network (red).
The interannual differences in the growth rate of atmospheric CO2 are greatly influenced by the El Niño-Southern Oscillation climate phenomenon. Its warm phase, El Niño, favours a greater increase in atmospheric CO2 concentration, while the cold phase, La Niña, is usually associated with more moderate growth rates. Figure 3 shows both the increases in the annual averages of IZO and the increases in the cross-year averages of the 12 months from June to May of the year following the reference year. The most recent La Niña (2020-2023), El Niño (2023-2024), and La Niña (2024-2026) episodes approximately correspond to the 2022-2023 minimum, the 2024-2025 maximum, and the latest value, 2025-2026, which is a provisional minimum in Figure 3.
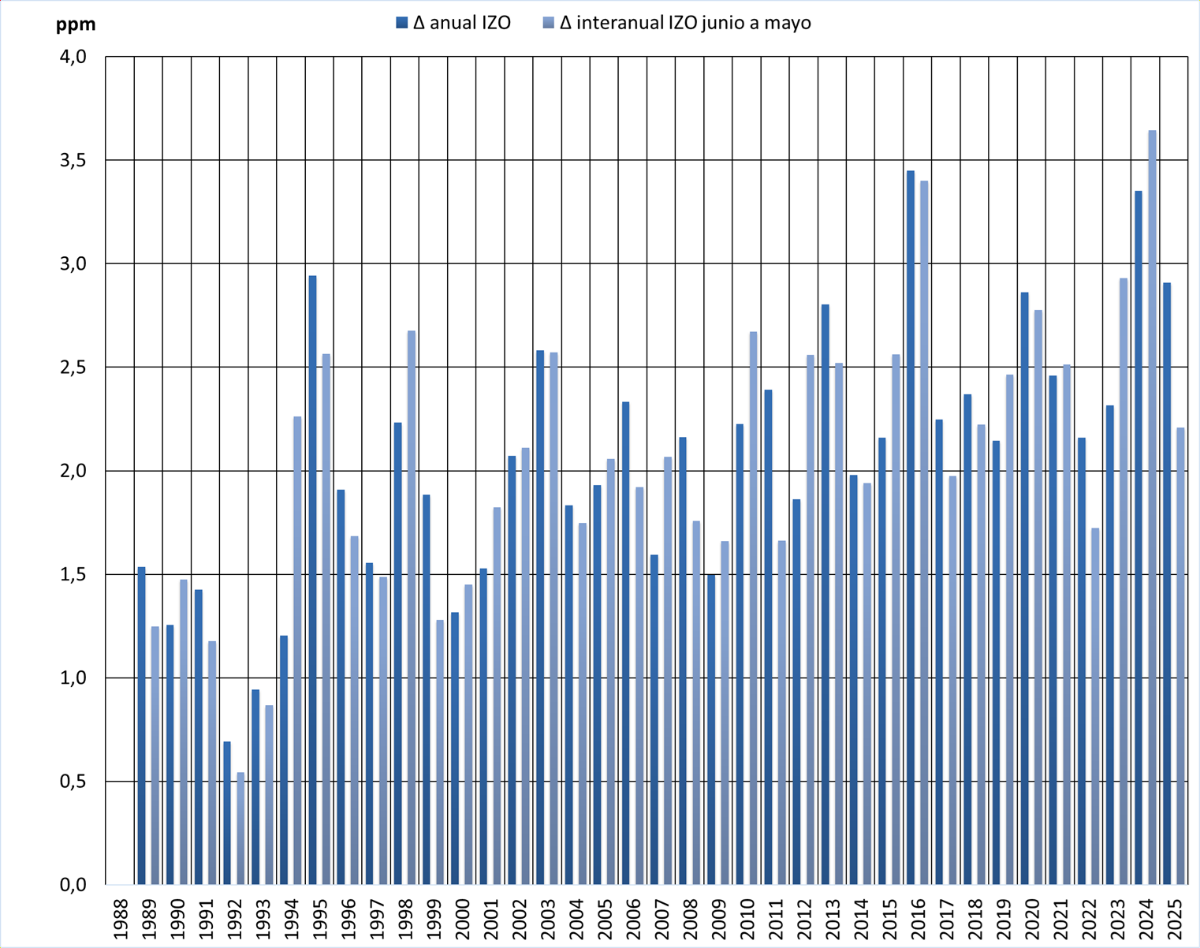
Figure 3. Increases in annual mean (from January to December) atmospheric CO2 concentration at the Izaña Observatory relative to the previous year (dark colour), and increases in cross-year averages over 12-month periods from June to May of the following year, relative to the corresponding preceding mean (light colour).
References:
Thoning, K. W., Tans, P. P., and Komhyr, W. D.: Atmospheric carbon dioxide at Mauna Loa Observatory: 2. Analysis of the NOAA GMCC data, 1974-1985, Journal of Geophysical Research: Atmospheres, 94, 8549-8565, https://doi.org/10.1029/JD094iD06p08549, 1989.
WMO: Greenhouse Gas Bulletin (GHG Bulletin), No. 21: The State of Greenhouse Gases in the Atmosphere Based on Global Observations through 2024, available at: https://wmo.int/files/greenhouse-gas-bulletin-no-21, 2025.